Visualising convergence (2-D and 3-D)
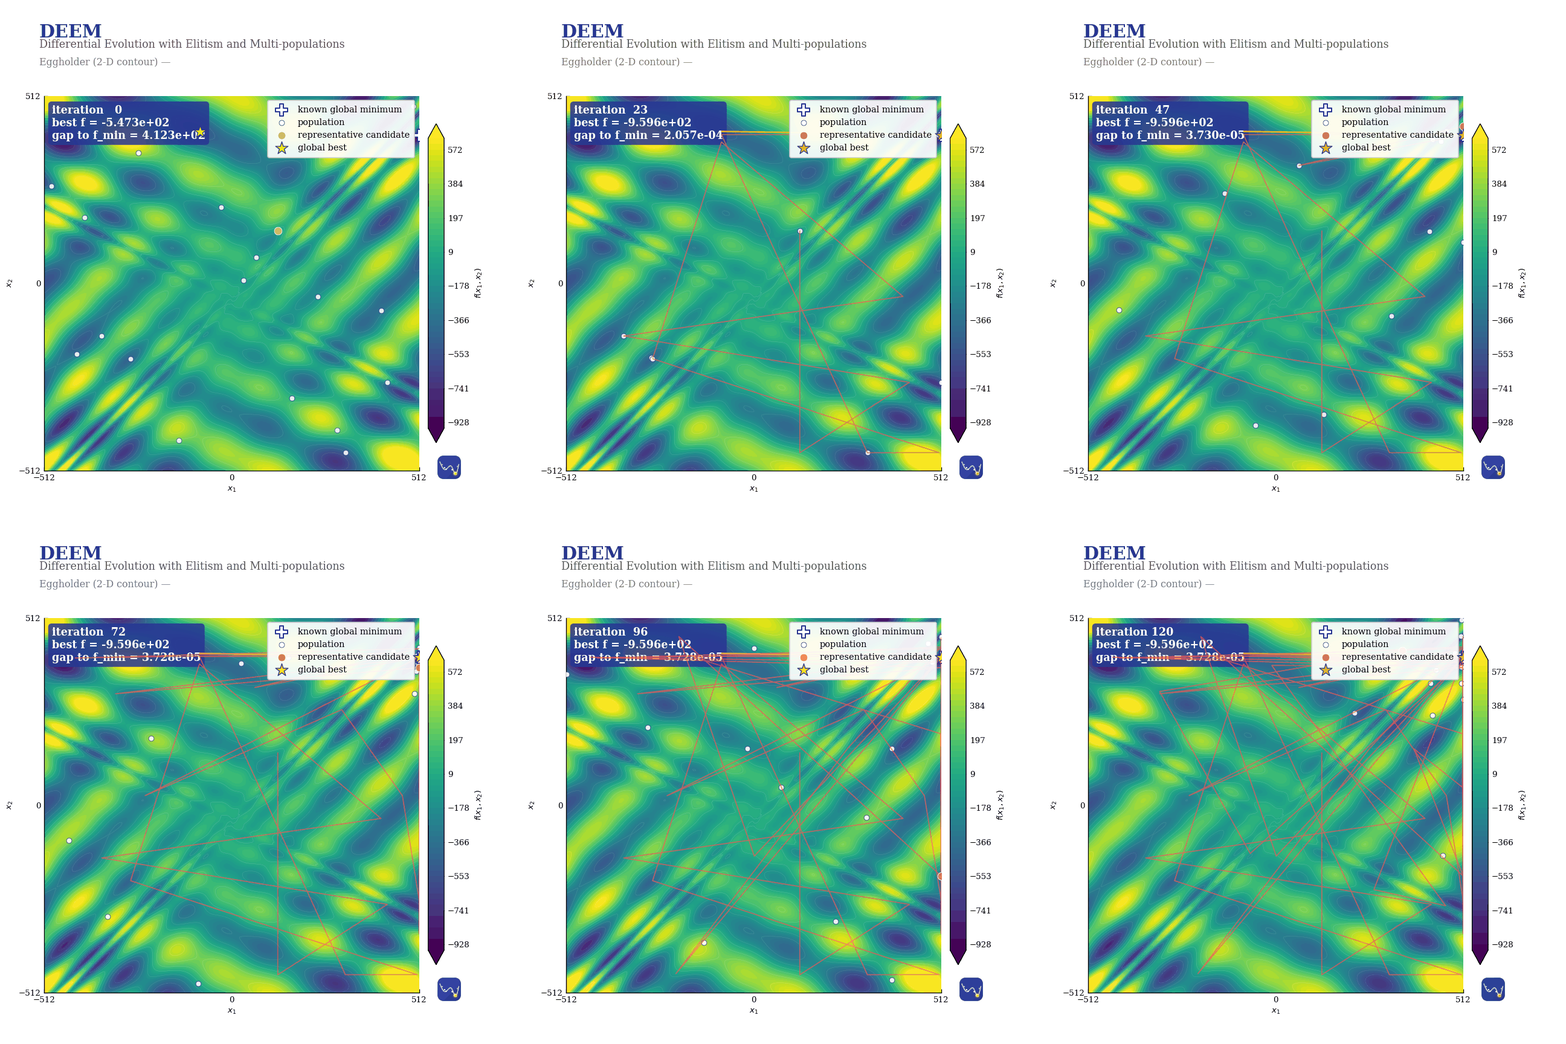
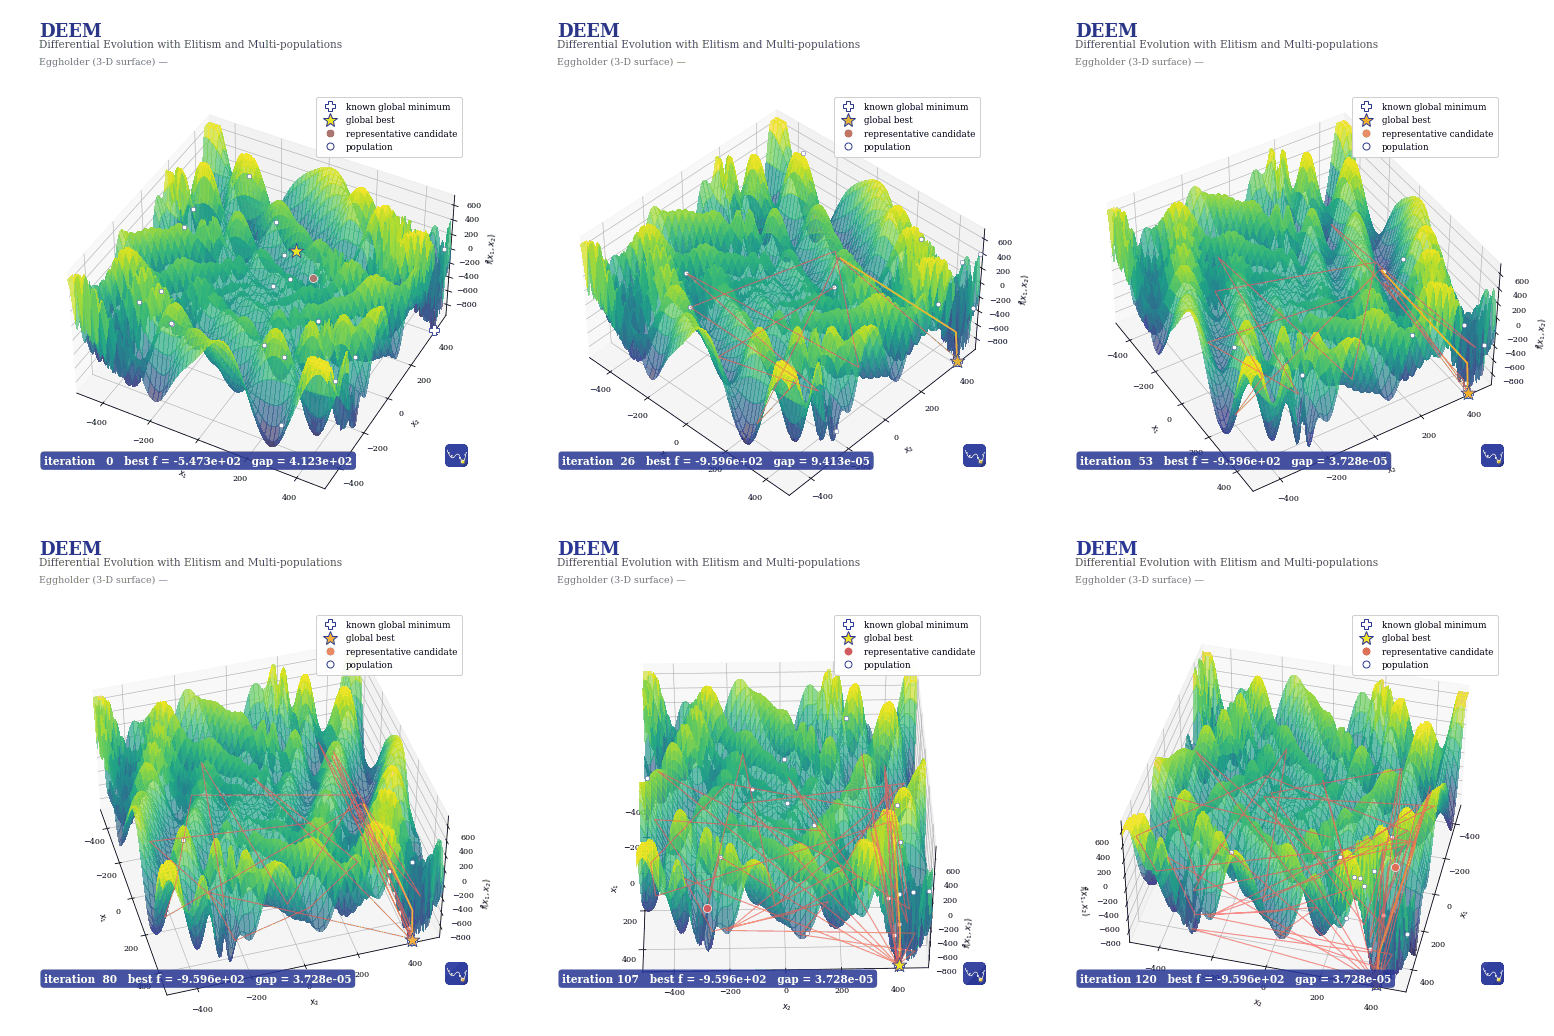
This example runs DEEMI on the 2-D Eggholder landscape and renders the optimisation two ways: a 2-D contour view and a 3-D surface view in which the elevation is the objective value \(f(x_1, x_2)\). Both show the population of candidate solutions moving each iteration and the running global best descending to the global minimum at the origin; the global best and one ordinary candidate are identified in a legend.
2-D contour view
3-D surface view (elevation = objective value)
The script
#!/usr/bin/env python3
"""
DEEMI benchmark animations in 2-D and 3-D.
This script runs DEEMI on a selectable 2-D optimisation benchmark function and
renders contour/surface animations of the optimisation history.
The benchmark functions are intentionally implemented in this file so that the
example remains self-contained with respect to the objective landscapes. DEEMI
itself is imported from the DEEM package/repository.
Recommended harder choices for animations:
* schwefel
* eggholder
* holder_table
* cross_in_tray
* levy
Examples
--------
Run the default benchmark selected below:
python examples/deemi_benchmark_animation.py
Run a specific benchmark:
python examples/deemi_benchmark_animation.py --function schwefel
python examples/deemi_benchmark_animation.py --function eggholder --maxiter 150
List available benchmarks:
python examples/deemi_benchmark_animation.py --list-functions
Export only the 2-D animation:
python examples/deemi_benchmark_animation.py --function levy --only 2d
The .gif files are convenient for documentation. The .mp4 files are H.264 videos
suited to presentations or social-media posts. MP4 export requires ffmpeg; if it
is unavailable, the script still writes GIF files.
"""
from __future__ import annotations
import argparse
import contextlib
import io
import math
import os
import sys
from dataclasses import dataclass
from pathlib import Path
from typing import Callable
import numpy as np
import matplotlib
matplotlib.use("Agg")
import matplotlib.pyplot as plt
from matplotlib import animation
from matplotlib.lines import Line2D
from matplotlib.offsetbox import AnnotationBbox, OffsetImage
# --------------------------------------------------------------------------- #
# User-facing defaults #
# --------------------------------------------------------------------------- #
# Change this single variable to switch the benchmark without using CLI flags.
# For a less "instant" animation than Rastrigin, use "schwefel" or "eggholder".
SELECTED_BENCHMARK = "eggholder"
SEED = 42
NPARTICLES = 20
MAXITER = 120
EXPORT_2D = True
EXPORT_3D = True
INDIGO = "#3f51b5"
INDIGO_DARK = "#283593"
GOLD = "#ffb300"
CORAL = "#ff5252"
TEAL = "#00acc1"
GREY = "#555555"
HERE = Path(__file__).resolve().parent
# --------------------------------------------------------------------------- #
# Robust import of DEEMI from either an installed package or the repository #
# --------------------------------------------------------------------------- #
def load_deem_class():
"""
Import the DEEM class.
The first import covers the normal package/repository-root case. The search
path extension covers the common examples/ layout, where this script sits in
a subdirectory next to the DEEM package directory.
"""
try:
from DEEM.DEEMI import DEEM
return DEEM
except ModuleNotFoundError:
pass
candidates = [
Path.cwd(),
HERE,
HERE.parent,
HERE.parent.parent,
]
for candidate in candidates:
candidate_str = str(candidate)
if candidate_str not in sys.path:
sys.path.insert(0, candidate_str)
try:
from DEEM.DEEMI import DEEM
return DEEM
except ModuleNotFoundError as exc:
raise ModuleNotFoundError(
"Could not import DEEM.DEEMI.DEEM. Run the script from the repository "
"root, install the DEEM package, or place this file in the examples/ "
"directory of the DEEM repository."
) from exc
_DEEM_CLASS = None
def get_deem_class():
"""Load DEEM lazily so --list-functions works without importing DEEMI."""
global _DEEM_CLASS
if _DEEM_CLASS is None:
_DEEM_CLASS = load_deem_class()
return _DEEM_CLASS
# --------------------------------------------------------------------------- #
# Benchmark function definitions #
# --------------------------------------------------------------------------- #
@dataclass(frozen=True)
class Benchmark:
"""Metadata and vectorised evaluation for a 2-D benchmark function."""
key: str
title: str
lower: np.ndarray
upper: np.ndarray
minima: np.ndarray
fmin: float
description: str
grid_function: Callable[[np.ndarray, np.ndarray], np.ndarray]
def scalar(self, x: np.ndarray) -> float:
x = np.asarray(x, dtype=float)
return float(self.grid_function(np.asarray(x[0]), np.asarray(x[1])))
def grid(self, X: np.ndarray, Y: np.ndarray) -> np.ndarray:
return self.grid_function(X, Y)
def symmetric_bounds(bound: float) -> tuple[np.ndarray, np.ndarray]:
return np.array([-bound, -bound], dtype=float), np.array([bound, bound], dtype=float)
def box_bounds(lower: float, upper: float) -> tuple[np.ndarray, np.ndarray]:
return np.array([lower, lower], dtype=float), np.array([upper, upper], dtype=float)
def rastrigin_grid(X: np.ndarray, Y: np.ndarray) -> np.ndarray:
return (
20.0
+ (X * X - 10.0 * np.cos(2.0 * np.pi * X))
+ (Y * Y - 10.0 * np.cos(2.0 * np.pi * Y))
)
def ackley_grid(X: np.ndarray, Y: np.ndarray) -> np.ndarray:
return (
-20.0 * np.exp(-0.2 * np.sqrt(0.5 * (X * X + Y * Y)))
- np.exp(0.5 * (np.cos(2.0 * np.pi * X) + np.cos(2.0 * np.pi * Y)))
+ math.e
+ 20.0
)
def griewank_grid(X: np.ndarray, Y: np.ndarray) -> np.ndarray:
return 1.0 + (X * X + Y * Y) / 4000.0 - np.cos(X) * np.cos(Y / np.sqrt(2.0))
def levy_grid(X: np.ndarray, Y: np.ndarray) -> np.ndarray:
w1 = 1.0 + (X - 1.0) / 4.0
w2 = 1.0 + (Y - 1.0) / 4.0
term1 = np.sin(np.pi * w1) ** 2
term2 = (w1 - 1.0) ** 2 * (1.0 + 10.0 * np.sin(np.pi * w1 + 1.0) ** 2)
term3 = (w2 - 1.0) ** 2 * (1.0 + np.sin(2.0 * np.pi * w2) ** 2)
return term1 + term2 + term3
def schwefel_grid(X: np.ndarray, Y: np.ndarray) -> np.ndarray:
return (
418.9829 * 2.0
- X * np.sin(np.sqrt(np.abs(X)))
- Y * np.sin(np.sqrt(np.abs(Y)))
)
def eggholder_grid(X: np.ndarray, Y: np.ndarray) -> np.ndarray:
return (
-(Y + 47.0) * np.sin(np.sqrt(np.abs(X / 2.0 + Y + 47.0)))
- X * np.sin(np.sqrt(np.abs(X - (Y + 47.0))))
)
def cross_in_tray_grid(X: np.ndarray, Y: np.ndarray) -> np.ndarray:
with np.errstate(over="ignore", invalid="ignore"):
expo = np.exp(np.abs(100.0 - np.sqrt(X * X + Y * Y) / np.pi))
value = -0.0001 * (np.abs(np.sin(X) * np.sin(Y) * expo) + 1.0) ** 0.1
return value
def holder_table_grid(X: np.ndarray, Y: np.ndarray) -> np.ndarray:
with np.errstate(over="ignore", invalid="ignore"):
expo = np.exp(np.abs(1.0 - np.sqrt(X * X + Y * Y) / np.pi))
value = -np.abs(np.sin(X) * np.cos(Y) * expo)
return value
def michalewicz_grid(X: np.ndarray, Y: np.ndarray, m: float = 10.0) -> np.ndarray:
i1 = 1.0
i2 = 2.0
return -(
np.sin(X) * np.sin(i1 * X * X / np.pi) ** (2.0 * m)
+ np.sin(Y) * np.sin(i2 * Y * Y / np.pi) ** (2.0 * m)
)
def make_benchmarks() -> dict[str, Benchmark]:
ras_lb, ras_ub = symmetric_bounds(5.12)
ack_lb, ack_ub = symmetric_bounds(5.0)
gri_lb, gri_ub = symmetric_bounds(10.0)
lev_lb, lev_ub = box_bounds(-10.0, 10.0)
sch_lb, sch_ub = box_bounds(-500.0, 500.0)
egg_lb, egg_ub = box_bounds(-512.0, 512.0)
cross_lb, cross_ub = symmetric_bounds(10.0)
hold_lb, hold_ub = symmetric_bounds(10.0)
mich_lb = np.array([0.0, 0.0], dtype=float)
mich_ub = np.array([np.pi, np.pi], dtype=float)
return {
"rastrigin": Benchmark(
key="rastrigin",
title="Rastrigin",
lower=ras_lb,
upper=ras_ub,
minima=np.array([[0.0, 0.0]], dtype=float),
fmin=0.0,
description="",
grid_function=rastrigin_grid,
),
"ackley": Benchmark(
key="ackley",
title="Ackley",
lower=ack_lb,
upper=ack_ub,
minima=np.array([[0.0, 0.0]], dtype=float),
fmin=0.0,
description="",
grid_function=ackley_grid,
),
"griewank": Benchmark(
key="griewank",
title="Griewank",
lower=gri_lb,
upper=gri_ub,
minima=np.array([[0.0, 0.0]], dtype=float),
fmin=0.0,
description="",
grid_function=griewank_grid,
),
"levy": Benchmark(
key="levy",
title="Levy",
lower=lev_lb,
upper=lev_ub,
minima=np.array([[1.0, 1.0]], dtype=float),
fmin=0.0,
description="",
grid_function=levy_grid,
),
"schwefel": Benchmark(
key="schwefel",
title="Schwefel",
lower=sch_lb,
upper=sch_ub,
minima=np.array([[420.968746, 420.968746]], dtype=float),
fmin=0.0,
description="",
grid_function=schwefel_grid,
),
"eggholder": Benchmark(
key="eggholder",
title="Eggholder",
lower=egg_lb,
upper=egg_ub,
minima=np.array([[512.0, 404.2319]], dtype=float),
fmin=-959.6407,
description="",
grid_function=eggholder_grid,
),
"cross_in_tray": Benchmark(
key="cross_in_tray",
title="Cross-in-tray",
lower=cross_lb,
upper=cross_ub,
minima=np.array(
[
[1.34941, 1.34941],
[1.34941, -1.34941],
[-1.34941, 1.34941],
[-1.34941, -1.34941],
],
dtype=float,
),
fmin=-2.06261,
description="",
grid_function=cross_in_tray_grid,
),
"holder_table": Benchmark(
key="holder_table",
title="Holder table",
lower=hold_lb,
upper=hold_ub,
minima=np.array(
[
[8.05502, 9.66459],
[8.05502, -9.66459],
[-8.05502, 9.66459],
[-8.05502, -9.66459],
],
dtype=float,
),
fmin=-19.2085,
description="Four pronounced minima near the domain corners.",
grid_function=holder_table_grid,
),
"michalewicz": Benchmark(
key="michalewicz",
title="Michalewicz",
lower=mich_lb,
upper=mich_ub,
minima=np.array([[2.2029, 1.5708]], dtype=float),
fmin=-1.8013,
description="Narrow curved valleys.",
grid_function=michalewicz_grid,
),
}
BENCHMARKS = make_benchmarks()
# --------------------------------------------------------------------------- #
# DEEMI subclass factory that records every iteration #
# --------------------------------------------------------------------------- #
def make_recording_deem_class(deem_class):
"""Create a DEEM subclass that records the population after each iteration."""
class RecordingDEEM(deem_class):
"""Record population, representative candidate, global best and best value."""
def __init__(self, *args, **kwargs):
self.frames = []
super().__init__(*args, **kwargs)
def update_archive(self):
super().update_archive()
P = np.array([candidate.x.copy() for candidate in self.candidates], dtype=float)
# Representative ordinary candidate: after archive sorting, the middle member
# is neither the current best nor the worst member. This avoids highlighting
# only the elite point and gives the animation a second visible trajectory.
ordinary_index = len(self.candidates) // 2
self.frames.append({
"it": int(self.iters),
"P": P,
"best": self.XBEST.copy(),
"fbest": float(self.FBEST),
"ordinary": P[ordinary_index].copy(),
})
return RecordingDEEM
def run_recorded(benchmark: Benchmark,
nparticles: int = NPARTICLES,
maxiter: int = MAXITER,
seed: int = SEED):
DEEMClass = get_deem_class()
RecordingDEEM = make_recording_deem_class(DEEMClass)
opt = RecordingDEEM(
function=benchmark.scalar,
lower_bound=benchmark.lower,
upper_bound=benchmark.upper,
nparticles_max=nparticles,
nparticles_min=nparticles,
npop_max=8,
npop_min=4,
maxiter=maxiter,
seed=seed,
)
with contextlib.redirect_stdout(io.StringIO()):
opt.update()
return opt.frames
# --------------------------------------------------------------------------- #
# Figure utilities #
# --------------------------------------------------------------------------- #
def add_badge(fig, xy=(0.86, 0.86), zoom=0.42):
"""Place the optional brand badge inside the figure with clear margins."""
badge = HERE / "deem-mark-badge.png"
if badge.exists():
ab = AnnotationBbox(
OffsetImage(plt.imread(str(badge)), zoom=zoom),
xy,
xycoords="figure fraction",
frameon=False,
zorder=10,
)
fig.add_artist(ab)
def header(fig, benchmark: Benchmark, view: str):
"""Consistent padded title block for exported animations."""
fig.suptitle("DEEM", x=0.075, y=0.955, ha="left",
fontsize=18, fontweight="bold", color=INDIGO_DARK)
fig.text(0.075, 0.908, "Differential Evolution with Elitism and Multi-populations",
ha="left", fontsize=10.5, color=GREY)
fig.text(
0.075,
0.875,
f"{benchmark.title} ({view}) — {benchmark.description}",
ha="left",
fontsize=9.5,
color="#777777",
)
def make_trails(frames, key: str):
"""Build cumulative unique-point trails for 'best' or 'ordinary' positions."""
trails = []
acc = []
for frame in frames:
x = frame[key]
if not acc or not np.allclose(acc[-1], x):
acc.append(x)
trails.append(np.array(acc, dtype=float))
return trails
def display_levels(Z: np.ndarray, benchmark: Benchmark):
"""
Robust z-limits for plotting.
Highly multimodal functions such as Schwefel and Eggholder contain large
peaks that dominate the colour scale. Clipping only the display range keeps
the basins and the population trajectory readable while the optimiser still
sees the true objective values.
"""
finite = Z[np.isfinite(Z)]
zlow = min(float(benchmark.fmin), float(np.percentile(finite, 0.5)))
zhigh = float(np.percentile(finite, 98.5))
if not np.isfinite(zhigh) or zhigh <= zlow:
zhigh = float(np.max(finite))
if zhigh <= zlow:
zhigh = zlow + 1.0
return zlow, zhigh
def clipped_z(benchmark: Benchmark, X, Y, zlow: float, zhigh: float):
return np.clip(benchmark.grid(np.asarray(X), np.asarray(Y)), zlow, zhigh)
def axis_ticks(lower: np.ndarray, upper: np.ndarray):
"""Compact ticks at lower bound, centre and upper bound."""
cx = 0.5 * (lower[0] + upper[0])
cy = 0.5 * (lower[1] + upper[1])
return [lower[0], cx, upper[0]], [lower[1], cy, upper[1]]
def safe_gap(fbest: float, fmin: float) -> float:
"""Gap to the known optimum, protecting against small negative round-off."""
return max(0.0, fbest - fmin)
# --------------------------------------------------------------------------- #
# 2-D contour animation #
# --------------------------------------------------------------------------- #
def build_2d(benchmark: Benchmark, frames, hold: int = 14):
gx = np.linspace(benchmark.lower[0], benchmark.upper[0], 460)
gy = np.linspace(benchmark.lower[1], benchmark.upper[1], 460)
X, Y = np.meshgrid(gx, gy)
Z = benchmark.grid(X, Y)
zlow, zhigh = display_levels(Z, benchmark)
Zplot = np.clip(Z, zlow, zhigh)
levels = np.linspace(zlow, zhigh, 52)
best_trails = make_trails(frames, "best")
ordinary_trails = make_trails(frames, "ordinary")
order = list(range(len(frames))) + [len(frames) - 1] * hold
fig, ax = plt.subplots(figsize=(7.2, 7.2))
fig.subplots_adjust(left=0.085, right=0.95, top=0.83, bottom=0.085)
contour = ax.contourf(X, Y, Zplot, levels=levels, cmap="viridis", extend="both")
ax.contour(X, Y, Zplot, levels=14, colors="white", linewidths=0.22, alpha=0.30)
cbar = fig.colorbar(contour, ax=ax, shrink=0.82, pad=0.02)
cbar.set_label("$f(x_1,x_2)$")
minima = benchmark.minima
ax.scatter(
minima[:, 0], minima[:, 1],
marker="P",
s=135,
facecolor="white",
edgecolor=INDIGO_DARK,
linewidth=1.2,
zorder=4,
label="known global minimum",
)
pop = ax.scatter(
[], [],
s=28,
facecolor="white",
edgecolor=INDIGO_DARK,
linewidth=0.55,
alpha=0.86,
zorder=3,
label="population",
)
ordinary = ax.scatter(
[], [],
s=58,
facecolor=CORAL,
edgecolor="white",
linewidth=0.6,
alpha=0.95,
zorder=5,
label="representative candidate",
)
best = ax.scatter(
[], [],
marker="*",
s=170,
facecolor=GOLD,
edgecolor=INDIGO_DARK,
linewidth=0.8,
zorder=6,
label="global best",
)
best_trail, = ax.plot([], [], color=GOLD, linewidth=1.55, alpha=0.90, zorder=4)
ordinary_trail, = ax.plot([], [], color=CORAL, linewidth=1.05, alpha=0.65, zorder=4)
ax.set_xlim(benchmark.lower[0], benchmark.upper[0])
ax.set_ylim(benchmark.lower[1], benchmark.upper[1])
xticks, yticks = axis_ticks(benchmark.lower, benchmark.upper)
ax.set_xticks(xticks)
ax.set_yticks(yticks)
ax.set_xlabel("$x_1$")
ax.set_ylabel("$x_2$")
ax.set_aspect("equal", adjustable="box")
ax.tick_params(direction="in")
ax.legend(loc="upper right", framealpha=0.92, fontsize=8.7, borderpad=0.6)
hud = ax.text(
0.02,
0.975,
"",
transform=ax.transAxes,
va="top",
ha="left",
fontsize=10.5,
color="white",
fontweight="bold",
bbox=dict(boxstyle="round,pad=0.35", fc=INDIGO_DARK, ec="none", alpha=0.86),
)
header(fig, benchmark, "2-D contour")
add_badge(fig, xy=(0.86, 0.105), zoom=0.38)
def update(frame_index):
frame = frames[order[frame_index]]
frame_id = order[frame_index]
P = frame["P"]
pop.set_offsets(P)
ordinary.set_offsets([frame["ordinary"]])
best.set_offsets([frame["best"]])
bp = best_trails[frame_id]
op = ordinary_trails[frame_id]
best_trail.set_data(bp[:, 0], bp[:, 1])
ordinary_trail.set_data(op[:, 0], op[:, 1])
hud.set_text(
f"iteration {frame['it']:>3d}\n"
f"best f = {frame['fbest']:.3e}\n"
f"gap to f_min = {safe_gap(frame['fbest'], benchmark.fmin):.3e}"
)
return pop, ordinary, best, best_trail, ordinary_trail, hud
anim = animation.FuncAnimation(fig, update, frames=len(order), interval=80, blit=False)
return fig, anim
# --------------------------------------------------------------------------- #
# 3-D surface animation #
# --------------------------------------------------------------------------- #
def build_3d(benchmark: Benchmark, frames, hold: int = 14):
gx = np.linspace(benchmark.lower[0], benchmark.upper[0], 170)
gy = np.linspace(benchmark.lower[1], benchmark.upper[1], 170)
X, Y = np.meshgrid(gx, gy)
Z = benchmark.grid(X, Y)
zlow, zhigh = display_levels(Z, benchmark)
Zplot = np.clip(Z, zlow, zhigh)
zrange = zhigh - zlow
zlift = 0.025 * zrange
best_trails = make_trails(frames, "best")
ordinary_trails = make_trails(frames, "ordinary")
order = list(range(len(frames))) + [len(frames) - 1] * hold
fig = plt.figure(figsize=(7.2, 7.2))
ax = fig.add_subplot(111, projection="3d")
ax.computed_zorder = False
fig.subplots_adjust(left=0.0, right=1.0, top=0.82, bottom=0.02)
ax.plot_surface(
X, Y, Zplot,
cmap="viridis",
alpha=0.68,
linewidth=0,
antialiased=False,
rcount=82,
ccount=82,
zorder=1,
)
minima = benchmark.minima
z_minima = clipped_z(benchmark, minima[:, 0], minima[:, 1], zlow, zhigh) + zlift
ax.scatter(
minima[:, 0], minima[:, 1], z_minima,
s=110,
marker="P",
color="white",
edgecolor=INDIGO_DARK,
linewidth=0.8,
depthshade=False,
zorder=6,
)
def z_of_points(P):
P = np.asarray(P, dtype=float)
return clipped_z(benchmark, P[:, 0], P[:, 1], zlow, zhigh) + zlift
pop = ax.scatter(
[], [], [],
s=22,
color="white",
edgecolor=INDIGO_DARK,
linewidth=0.4,
depthshade=False,
zorder=5,
)
ordinary = ax.scatter(
[], [], [],
s=66,
color=CORAL,
edgecolor="white",
linewidth=0.65,
depthshade=False,
zorder=7,
)
best = ax.scatter(
[], [], [],
s=240,
color=GOLD,
marker="*",
edgecolor=INDIGO_DARK,
linewidth=0.7,
depthshade=False,
zorder=8,
)
best_trail, = ax.plot([], [], [], color=GOLD, linewidth=1.8, alpha=0.9, zorder=6)
ordinary_trail, = ax.plot([], [], [], color=CORAL, linewidth=1.1, alpha=0.65, zorder=6)
ax.set_xlim(benchmark.lower[0], benchmark.upper[0])
ax.set_ylim(benchmark.lower[1], benchmark.upper[1])
ax.set_zlim(zlow, zhigh + 2.5 * zlift)
ax.set_xlabel("$x_1$")
ax.set_ylabel("$x_2$")
ax.set_zlabel("$f(x_1,x_2)$")
ax.set_box_aspect((1, 1, 0.58))
ax.tick_params(direction="in")
legend_handles = [
Line2D([0], [0], marker="P", color="none", markerfacecolor="white",
markeredgecolor=INDIGO_DARK, markersize=10, label="known global minimum"),
Line2D([0], [0], marker="*", color="none", markerfacecolor=GOLD,
markeredgecolor=INDIGO_DARK, markersize=15, label="global best"),
Line2D([0], [0], marker="o", color="none", markerfacecolor=CORAL,
markeredgecolor="white", markersize=9, label="representative candidate"),
Line2D([0], [0], marker="o", color="none", markerfacecolor="white",
markeredgecolor=INDIGO_DARK, markersize=7, label="population"),
]
ax.legend(handles=legend_handles, loc="upper right", fontsize=8.7,
framealpha=0.92, borderpad=0.6)
hud = fig.text(
0.085,
0.10,
"",
va="bottom",
ha="left",
fontsize=10.5,
color="white",
fontweight="bold",
bbox=dict(boxstyle="round,pad=0.35", fc=INDIGO_DARK, ec="none", alpha=0.86),
)
header(fig, benchmark, "3-D surface")
add_badge(fig, xy=(0.88, 0.12), zoom=0.38)
def update(frame_index):
frame = frames[order[frame_index]]
frame_id = order[frame_index]
P = frame["P"]
pop._offsets3d = (P[:, 0], P[:, 1], z_of_points(P))
ordinary_point = np.asarray([frame["ordinary"]], dtype=float)
ordinary._offsets3d = (
ordinary_point[:, 0],
ordinary_point[:, 1],
z_of_points(ordinary_point),
)
best_point = np.asarray([frame["best"]], dtype=float)
best._offsets3d = (
best_point[:, 0],
best_point[:, 1],
z_of_points(best_point),
)
bp = best_trails[frame_id]
op = ordinary_trails[frame_id]
best_trail.set_data(bp[:, 0], bp[:, 1])
best_trail.set_3d_properties(z_of_points(bp))
ordinary_trail.set_data(op[:, 0], op[:, 1])
ordinary_trail.set_3d_properties(z_of_points(op))
# Gentle orbit: enough parallax to understand the surface, but not so much
# that the viewer loses the population trajectory.
ax.view_init(elev=42, azim=-62 + 76 * frame_index / max(1, len(order) - 1))
hud.set_text(
f"iteration {frame['it']:>3d} "
f"best f = {frame['fbest']:.3e} "
f"gap = {safe_gap(frame['fbest'], benchmark.fmin):.3e}"
)
return pop, ordinary, best, best_trail, ordinary_trail, hud
anim = animation.FuncAnimation(fig, update, frames=len(order), interval=80, blit=False)
return fig, anim
# --------------------------------------------------------------------------- #
# Export and command-line interface #
# --------------------------------------------------------------------------- #
def export(fig, anim, stem: str, output_dir: Path,
gif_fps: int = 10, mp4_fps: int = 10,
gif_dpi: int = 120, mp4_dpi: int = 150):
output_dir.mkdir(parents=True, exist_ok=True)
gif = output_dir / f"{stem}.gif"
anim.save(str(gif), writer=animation.PillowWriter(fps=gif_fps), dpi=gif_dpi)
print("wrote", gif)
mp4 = output_dir / f"{stem}.mp4"
try:
anim.save(
str(mp4),
writer=animation.FFMpegWriter(fps=mp4_fps, bitrate=4200),
dpi=mp4_dpi,
)
print("wrote", mp4)
except Exception as exc:
print(f"MP4 export skipped (ffmpeg unavailable?): {exc}")
plt.close(fig)
def print_available_functions():
print("Available benchmark functions:\n")
for key, benchmark in BENCHMARKS.items():
print(f" {key:<14} {benchmark.title:<15} {benchmark.description}")
def parse_args():
parser = argparse.ArgumentParser(
description="Run DEEMI and export 2-D/3-D optimisation animations.",
formatter_class=argparse.ArgumentDefaultsHelpFormatter,
)
parser.add_argument(
"--function",
choices=list(BENCHMARKS.keys()) + ["all"],
default=SELECTED_BENCHMARK,
help="benchmark function to run",
)
parser.add_argument(
"--list-functions",
action="store_true",
help="list available functions and exit",
)
parser.add_argument("--maxiter", type=int, default=MAXITER, help="maximum DEEMI iterations")
parser.add_argument("--nparticles", type=int, default=NPARTICLES, help="population size")
parser.add_argument("--seed", type=int, default=SEED, help="random seed")
parser.add_argument(
"--only",
choices=["2d", "3d", "both"],
default="both" if EXPORT_2D and EXPORT_3D else "2d" if EXPORT_2D else "3d",
help="which animation view to export",
)
parser.add_argument(
"--output-dir",
type=Path,
default=HERE,
help="directory for GIF/MP4 output",
)
return parser.parse_args()
def run_one(benchmark: Benchmark, args):
frames = run_recorded(
benchmark=benchmark,
nparticles=args.nparticles,
maxiter=args.maxiter,
seed=args.seed,
)
print(
f"{benchmark.key}: recorded {len(frames)} iterations; "
f"final best f = {frames[-1]['fbest']:.3e}; "
f"gap to known f_min = {safe_gap(frames[-1]['fbest'], benchmark.fmin):.3e}"
)
stem = f"deemi_{benchmark.key}"
if args.only in ("2d", "both"):
fig2, anim2 = build_2d(benchmark, frames)
export(fig2, anim2, f"{stem}_2d", args.output_dir)
if args.only in ("3d", "both"):
fig3, anim3 = build_3d(benchmark, frames)
export(fig3, anim3, f"{stem}_3d", args.output_dir, gif_dpi=72)
def main():
args = parse_args()
if args.list_functions:
print_available_functions()
return
if args.function == "all":
selected = BENCHMARKS.values()
else:
selected = [BENCHMARKS[args.function]]
for benchmark in selected:
run_one(benchmark, args)
if __name__ == "__main__":
main()
Running it
The animation needs matplotlib; the MP4 export additionally needs ffmpeg (the script
falls back to GIF-only if ffmpeg is unavailable). The brand badge inset is optional —
the script skips it if deem-mark-badge.png is not next to it.