Amplitude manager
An amplitude is a function of time. Loads and boundary conditions reference an amplitude by name, and their magnitude at any moment is the specified value multiplied by the amplitude at that time. This separates how much is applied from when it is applied, so the same time history can drive several loads at once.
Defining an amplitude and using it are two steps: the manager creates the definition, and a load or boundary condition then references it by name.
Open the manager with the  button in the numgeo toolbar, from numgeo → Manager → Amplitude, or from a
load or boundary condition when picking an amplitude.
button in the numgeo toolbar, from numgeo → Manager → Amplitude, or from a
load or boundary condition when picking an amplitude.
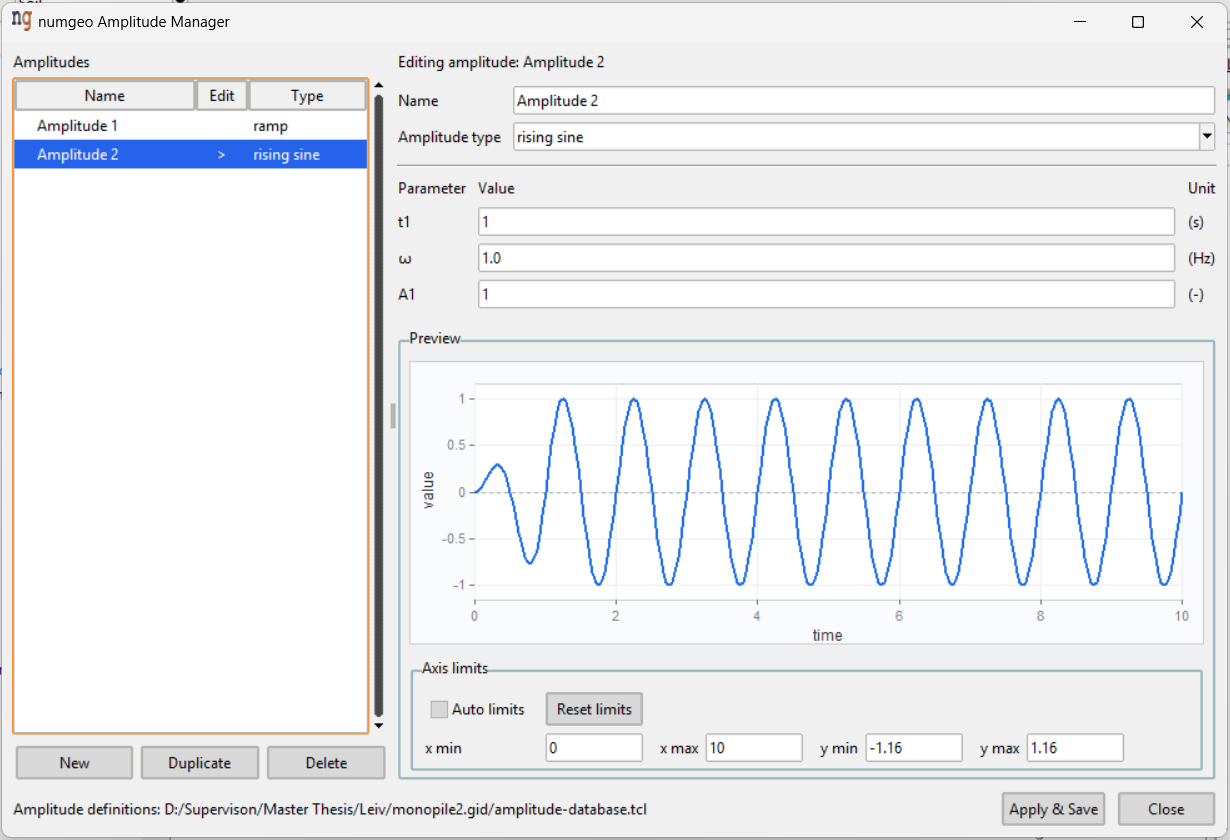
Window layout
The Amplitudes list on the left shows each amplitude with its type, and marks the one being edited. New, Duplicate and Delete underneath act on whole amplitudes.
On the right, the name and amplitude type sit above a parameter table whose contents change with the type, and the Preview plot fills the lower half of the window.
Apply & Save and Close sit at the bottom. Select appears in place of Close when the manager was opened in order to pick an amplitude, and returns the current one.
Preview
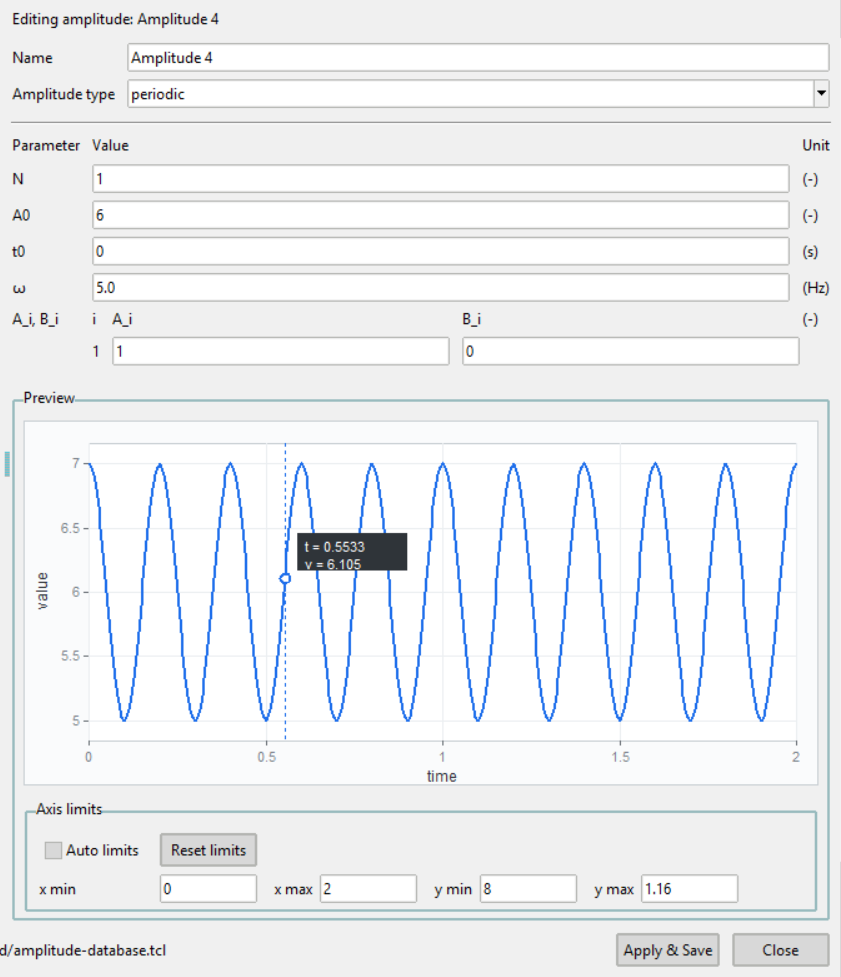
The plot redraws as parameters are typed. It is the fastest way to catch a wrong sign, a misplaced decimal point or a frequency that is an order of magnitude off, so it is worth watching while entering values.
Hovering over the curve reads off the time and value at that point.
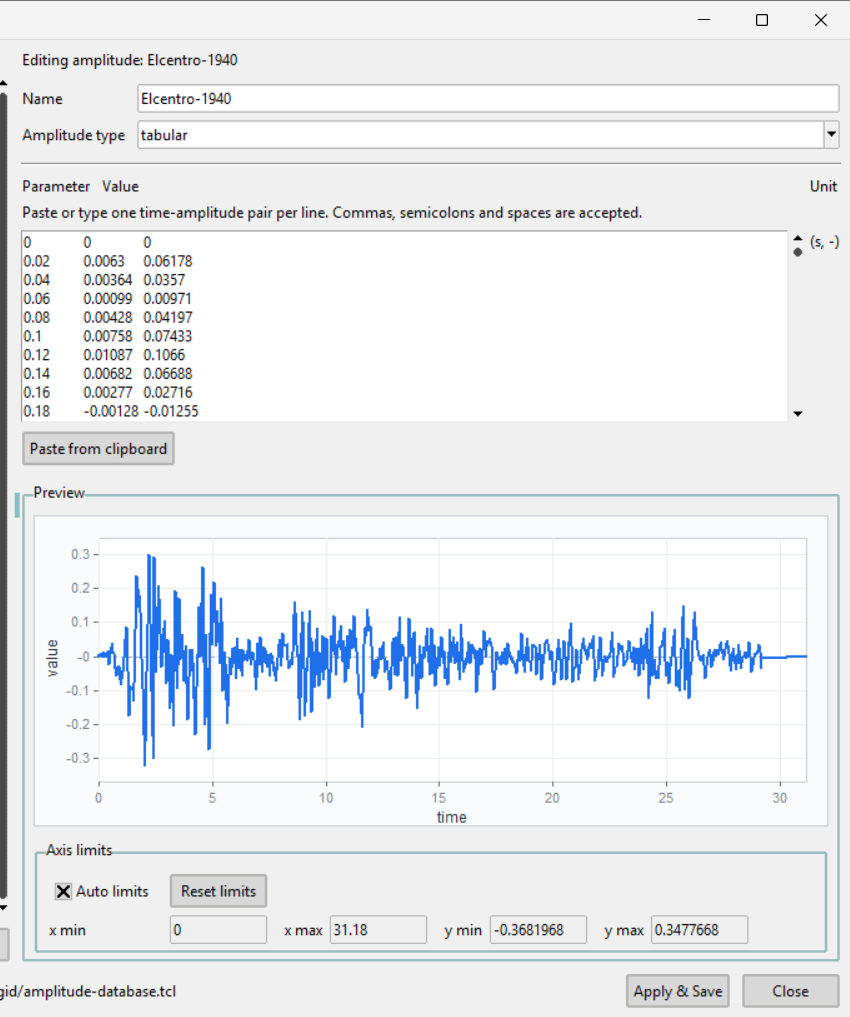
Auto limits keeps the axes following the data, and is on by default. Clearing it enables the x min, x max, y min and y max fields, so a particular window of a long signal can be inspected — the first two seconds of an earthquake record, or a single cycle of a periodic signal. Reset limits returns the fields to the range of the current data.
Amplitude types
A new amplitude starts as a ramp from (0, 0) to (1, 1). Changing the type
rebuilds the parameter table, so choose it before entering values.
Ramp
A linear transition from one value to another, held constant outside the transition.
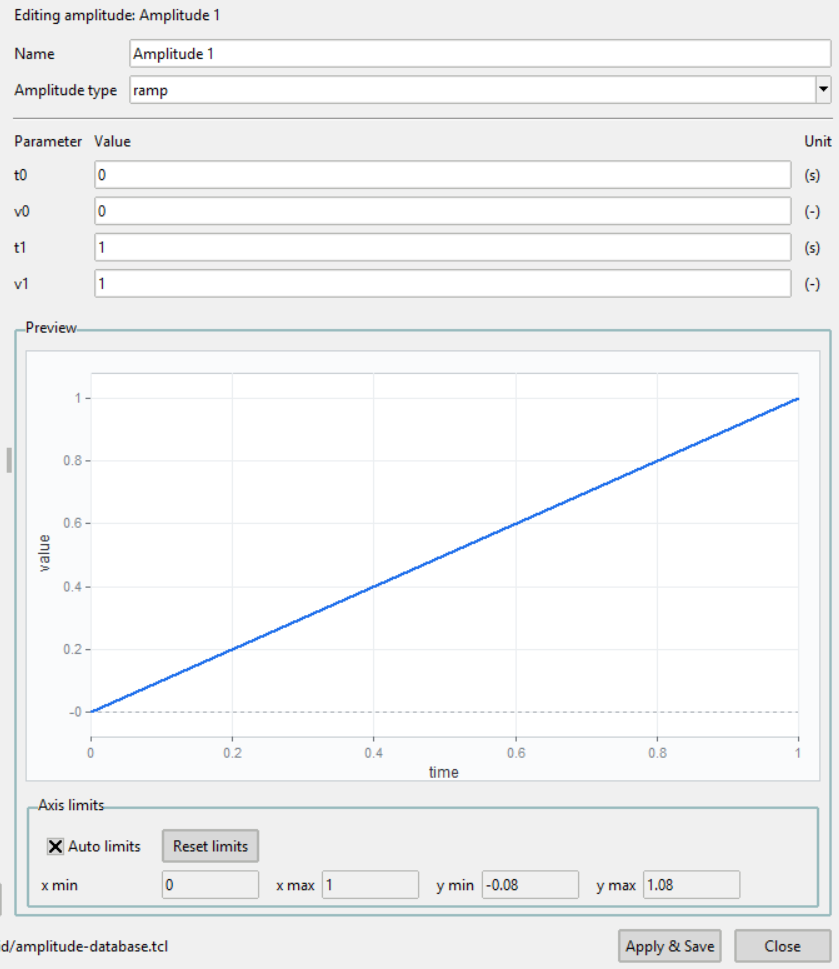
| Parameter | Unit | Meaning |
|---|---|---|
t0 |
s | Time at the start of the ramp |
v0 |
– | Value at the start of the ramp |
t1 |
s | Time at the end of the ramp |
v1 |
– | Value at the end of the ramp |
This is the most common amplitude type. A ramp from (0, 0) to (t1, 1) is the
usual way to apply a static load gradually instead of as a step, which avoids
the numerical shock of instantaneous loading.
All four parameters must be numeric.
Rising sine / rising cosine
A harmonic signal multiplied by a linearly rising envelope, so the excitation grows from zero rather than switching on abruptly.
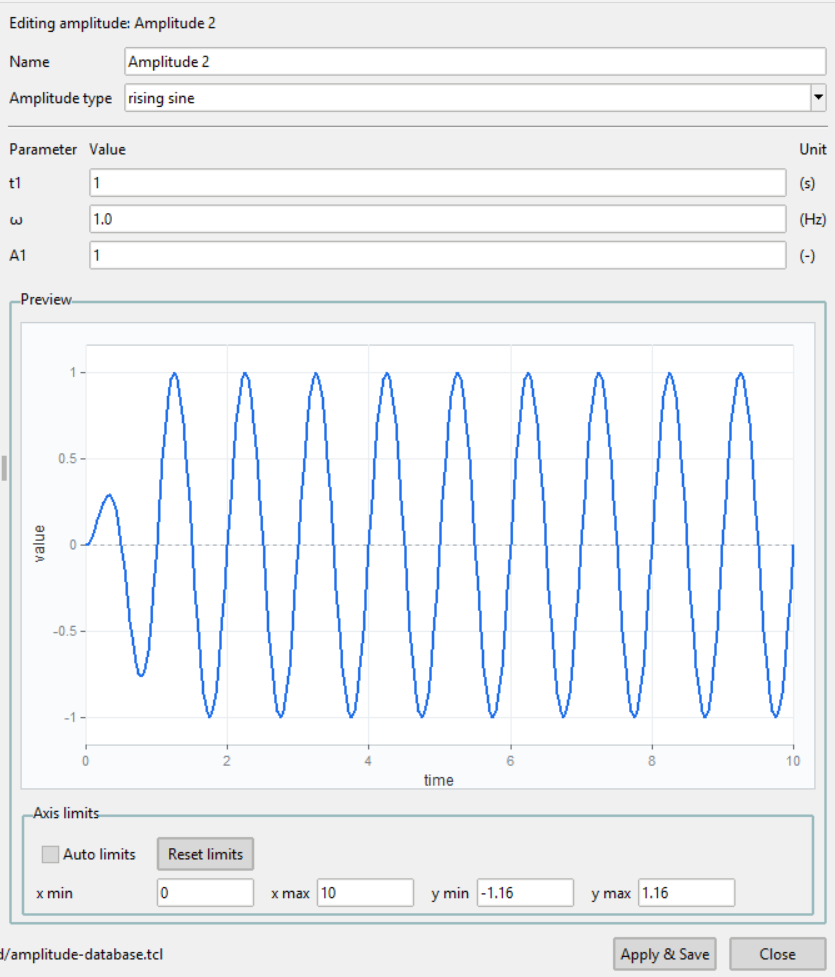
with cosine as the alternative carrier.
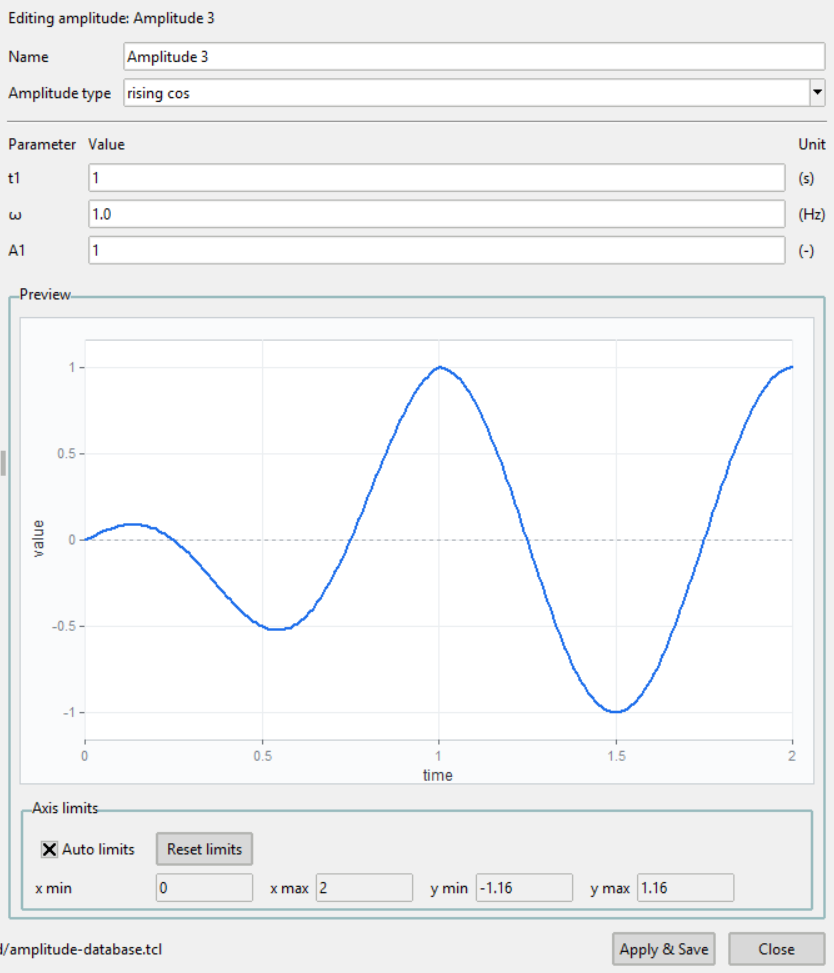
| Parameter | Unit | Meaning |
|---|---|---|
t1 |
s | Duration of the rise phase |
ω |
Hz | Frequency of the carrier |
A1 |
– | Amplitude reached at the end of the rise |
The envelope is what makes these useful for dynamic and seismic problems.
Switching a harmonic load on at full amplitude excites the whole frequency
content of the model at once; growing it over t1 does not.
All three parameters must be numeric, and t1 must be positive.
Periodic
A truncated Fourier series, for signals that repeat but are not a single harmonic.
for t ≥ t0, and zero before.
| Parameter | Unit | Meaning |
|---|---|---|
N |
– | Number of harmonics |
A0 |
– | Constant offset |
t0 |
s | Start time of the periodic phase |
ω |
Hz | Fundamental frequency |
Below these, a table of A_i and B_i coefficients appears with one row per
harmonic. The number of rows follows N automatically.
N must be a positive integer, ω must not be zero, and every harmonic needs
its coefficient pair.
Tabular
Any piecewise-linear time history, entered as one time–value pair per line. numgeo interpolates linearly between the rows.
0.0 0.0 0.5 1.0 1.5 1.0 2.0 0.0
This is the type to use for measured signals — an earthquake record, a monitored water level, a load history from a test.
The parser is tolerant: spaces, commas, semicolons and tabs all work as separators, blank lines are ignored, and rows that do not contain two valid numbers are skipped. Columns can therefore be pasted straight from a spreadsheet or CSV file without cleanup, and Paste from clipboard does exactly that.
At least one valid time–value pair is required.
Warning
Because malformed rows are skipped silently, a file with a header line or a stray text column will load without complaint but with fewer points than expected. Check the plot after pasting a long series.
Validation
Amplitudes are checked when Apply & Save is pressed. The name must not be empty, and each type has the rules given above.
A problem shows a warning naming it, and the amplitude stays open so it can be corrected.
Amplitudes are described under Amplitude in the numgeo reference manual.