Drained monotonic triaxial tests on sand
Introduction
The drained monotonic triaxial test is a widely used laboratory tests to investigate the shear strength of coarse grained soils. A typical triaxial testing device is depicted below.
Slider 1: Testing device for a drained monotonic triaxial test, with sample volume changes measured by water level fluctuations in the burettes.
The test setup matches the one outlined in the introduction to triaxial tests. In a drained, monotonic triaxial test, the specimen is typically water-saturated. When the specimen deforms volumetrically under the applied external load, water is either expelled through the filter stone into the burette during a reduction in volume, or drawn from the burette into the specimen during an increase in volume (dilatancy). The resulting changes in water level within the burette system enable the calculation of the specimen’s average volumetric deformations.
Shearing velocity
Using a saturated soil sample is advantageous for measuring volumetric strain, as the volume change can be directly measured from the water inflow or outflow from the specimen. However, to ensure drained conditions, meaning no change in pore water pressure, the shearing process's velocity must be sufficiently slow to guarantee pressure-free water inflow and outflow. Due to this restriction the drained monotonic triaxial test is typically not used for fine-grained soils such as clays.
Triaxial test on a loose sand
The animation below illustrates typical results of a drained monotonic triaxial test on loose sand, showing the deviatoric stress \(q\) plotted against the axial strain \(\varepsilon_1\) (on the left) and the deviatoric stress plotted against the mean effective stress \(p^\prime\) (on the right).
Animation 1: Typical results of a monotonic triaxial test on loose sand in the \(\varepsilon_1-q\) plane and \(p^\prime-q\) plane, experimental data from 1
Above animation shows an increase of deviatoric stress \(q\) with increasing axial strain \(\varepsilon_1\). While the rate of increase in \(q\) is high at the beginning, i.e. small changes \(\Delta \varepsilon_1\) result in significant changes of \(\Delta q\). However, as shearing continues, the rate increase slows down until \(q\) asymptotically approaches its maximum value. In the \(p^\prime-q\) plane, the resulting stress path is linear, and, consistent with the \(\varepsilon_1-q\) plane, eventually reaches its maximum value. Even as the sample undergoes further shearing, no additional rise in the deviatoric stress \(q\) is noted. This signifies that the soil has attained its maximum shear stress capacity, and no extra resistance can be generated against the applied deformation. Importantly, the stress path in the \(p^\prime-q\) space follows the distinctly characteristic 1:3 slope.
Why 1:3?
The characteristic slope of 1:3 in drained monotonic triaxial tests originates from the sample geometry and test conditions. Recall the definition of the Roscoe invariants for triaxial conditions:
we can analogously calculate the incremental change in \(p^\prime\) and \(q\):
Given that \(\Delta \sigma_3^\prime=0\) and substituting the equation for \(\Delta p^\prime\) in \(\Delta q\) we obtain:
In the animation below, the left-hand side illustrates the evolution of the volumetric strain \(\varepsilon_v\) as a function of the axial strain \(\varepsilon_1\), whilst the right-hand side presents the development of the void ratio \(e\) plotted against the mean effective stress \(p^\prime\). It can be observed, that at the beginning of the shearing the volumetric strain increases slightly. Positive volumetric strain is associated with a decrease in volume, which is also reflected in the development of the void ratio: at the beginning of the shearing, the void ratio decreases. The increase of volumetric strain with increasing axial strain is referred to as "contractive behaviour". For the given loose sand sample, the magnitude of the changes in volumetric strain relative to the axial strain remains relatively minor. This minor response in terms of volume change, despite significant axial deformation, is representative of the typical behaviour shown by loose soil samples during such tests.
Animation 2: Typical results of a monotonic triaxial test on loose sand in the \(\varepsilon_1-\varepsilon_v\) plane and \(p^\prime-e\) plane, experimental data from 1
Triaxial test on a dense sand
As with the depiction of the typical results from a triaxial compression test on a loose sand sample, the subsequent animation shows the variation of the deviatoric stress \(q\) in relation to the axial strain \(\varepsilon_1\) and the mean effective stress \(p^\prime\). It's noteworthy that both the loose and dense samples underwent the test at identical initial mean effective stresses.
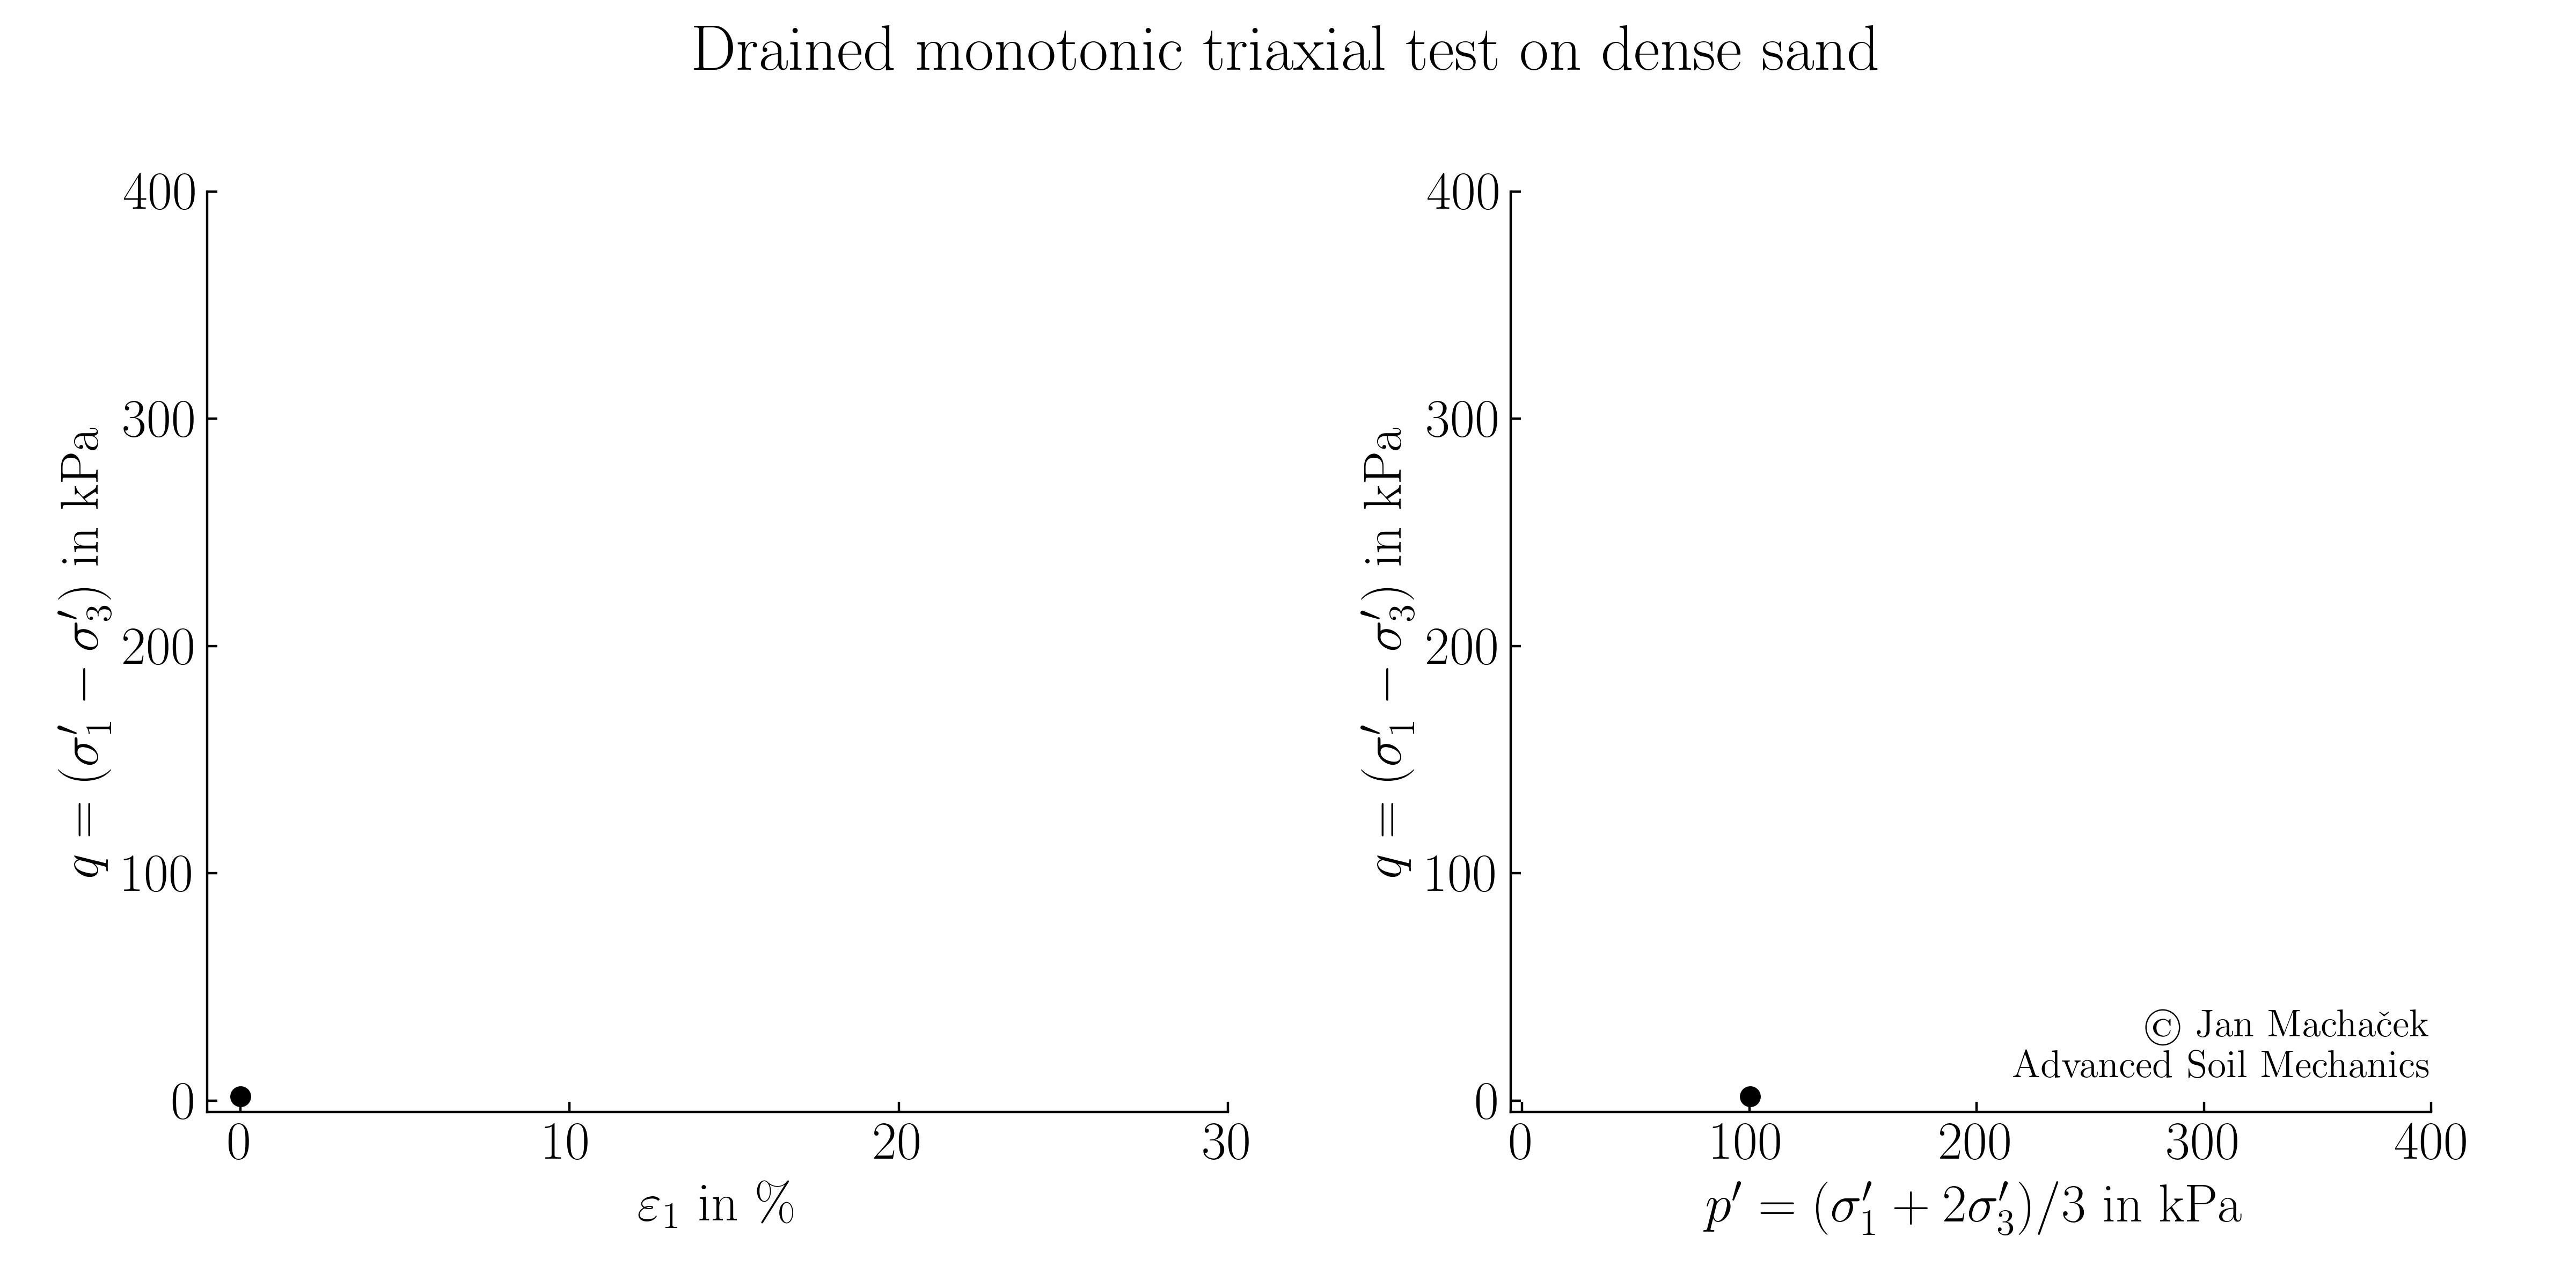 Typical results of a monotonic triaxial test on dense sand in the \(\varepsilon_1-q\) plane and \(p^\prime-q\) plane, experimental data from 1 (click to play)
Similar to the behaviour witnessed in the loose sample, the dense sand also presents a fast increase in \(q\) during the preliminary phase of shearing. Contrary to its loose counterpart, the dense sample doesn’t tend towards an asymptotic maximum. Instead, it surpasses the maximum deviatoric stress of the loose sample, resulting in a markedly pronounced peak. As shearing persists, this deviatoric stress starts to decrease, gravitating towards the maximum value seen with the loose sample. The increase in deviatoric stress up to its peak value is called "strain hardening". Conversely, the subsequent drop post-peak is denoted as "strain softening". Looking at the \(p^\prime-q\) plane, one observes that the stress path follows the characteristic 1:3 inclination, akin to the loose sample. Nonetheless, the dense sample’s distinctive peak and subsequent softening are as well evident in this plane.
In the below animation, the corresponding evolution of volumetric strain for the dense sand sample is depicted. The observed behaviour contrasts significantly with that of loose sand. While the loose sand predominantly exhibits a contractive response, the dense sand demonstrates a brief initial phase of contraction before transitioning into pronounced dilatant behaviour.
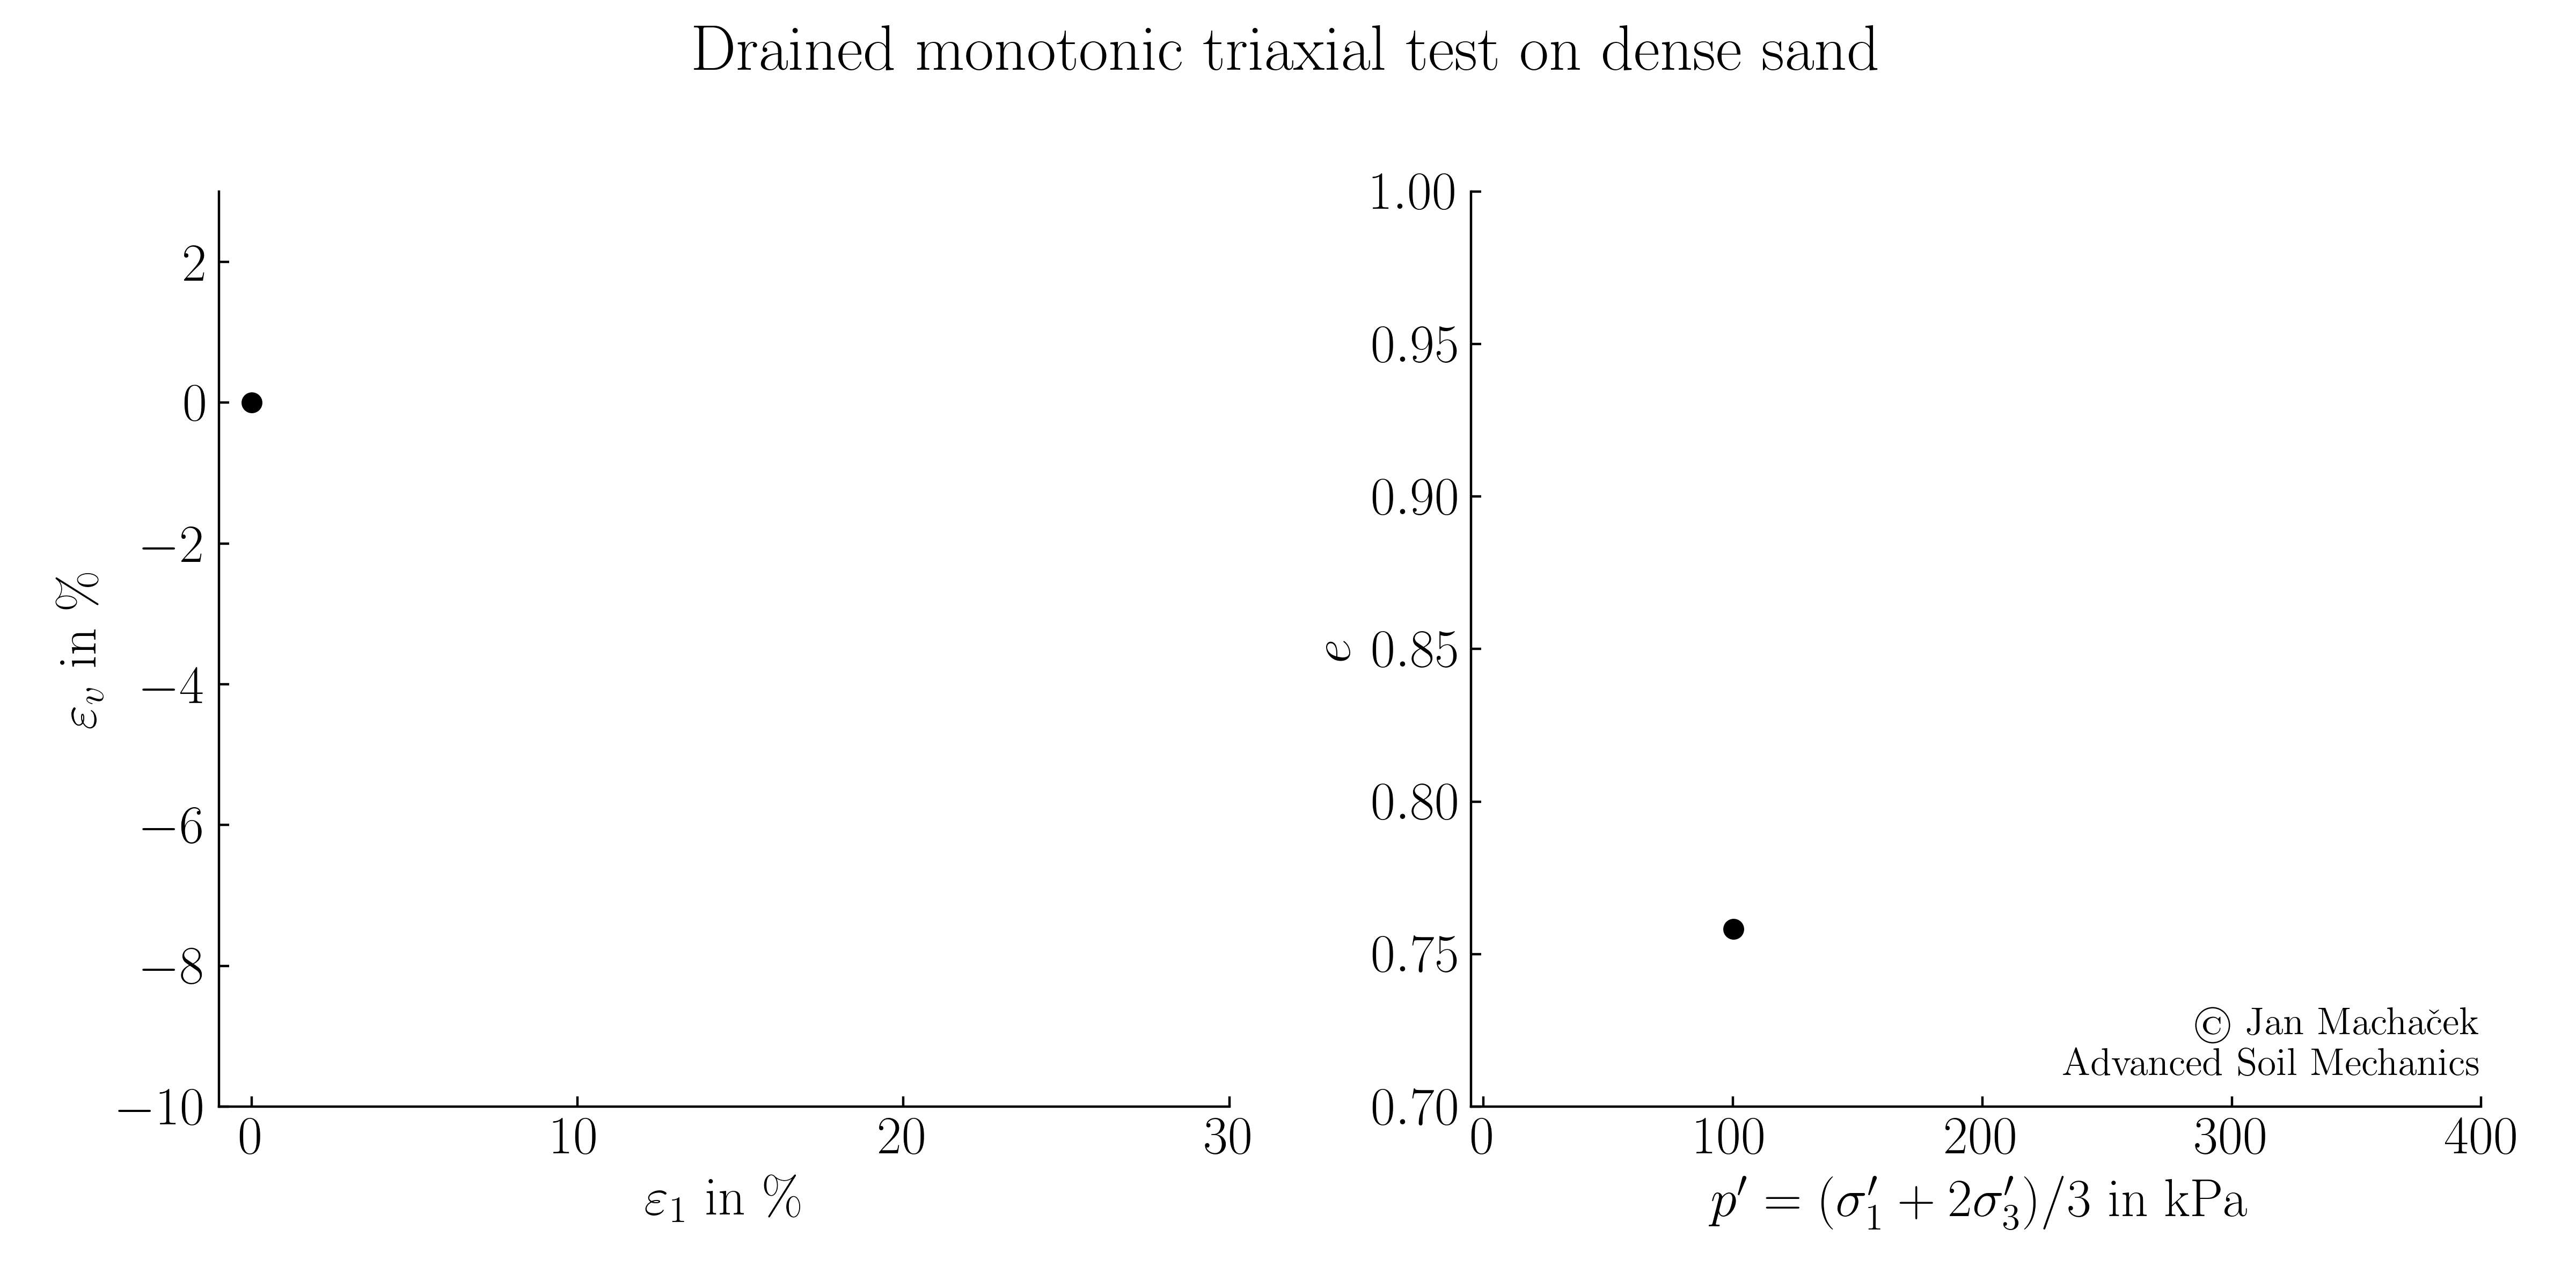 Typical results of a monotonic triaxial test on loose sand in the \(\varepsilon_1-\varepsilon_v\) plane and \(p^\prime-e\) plane, experimental data from 1 (click to play)
Concluding comparison
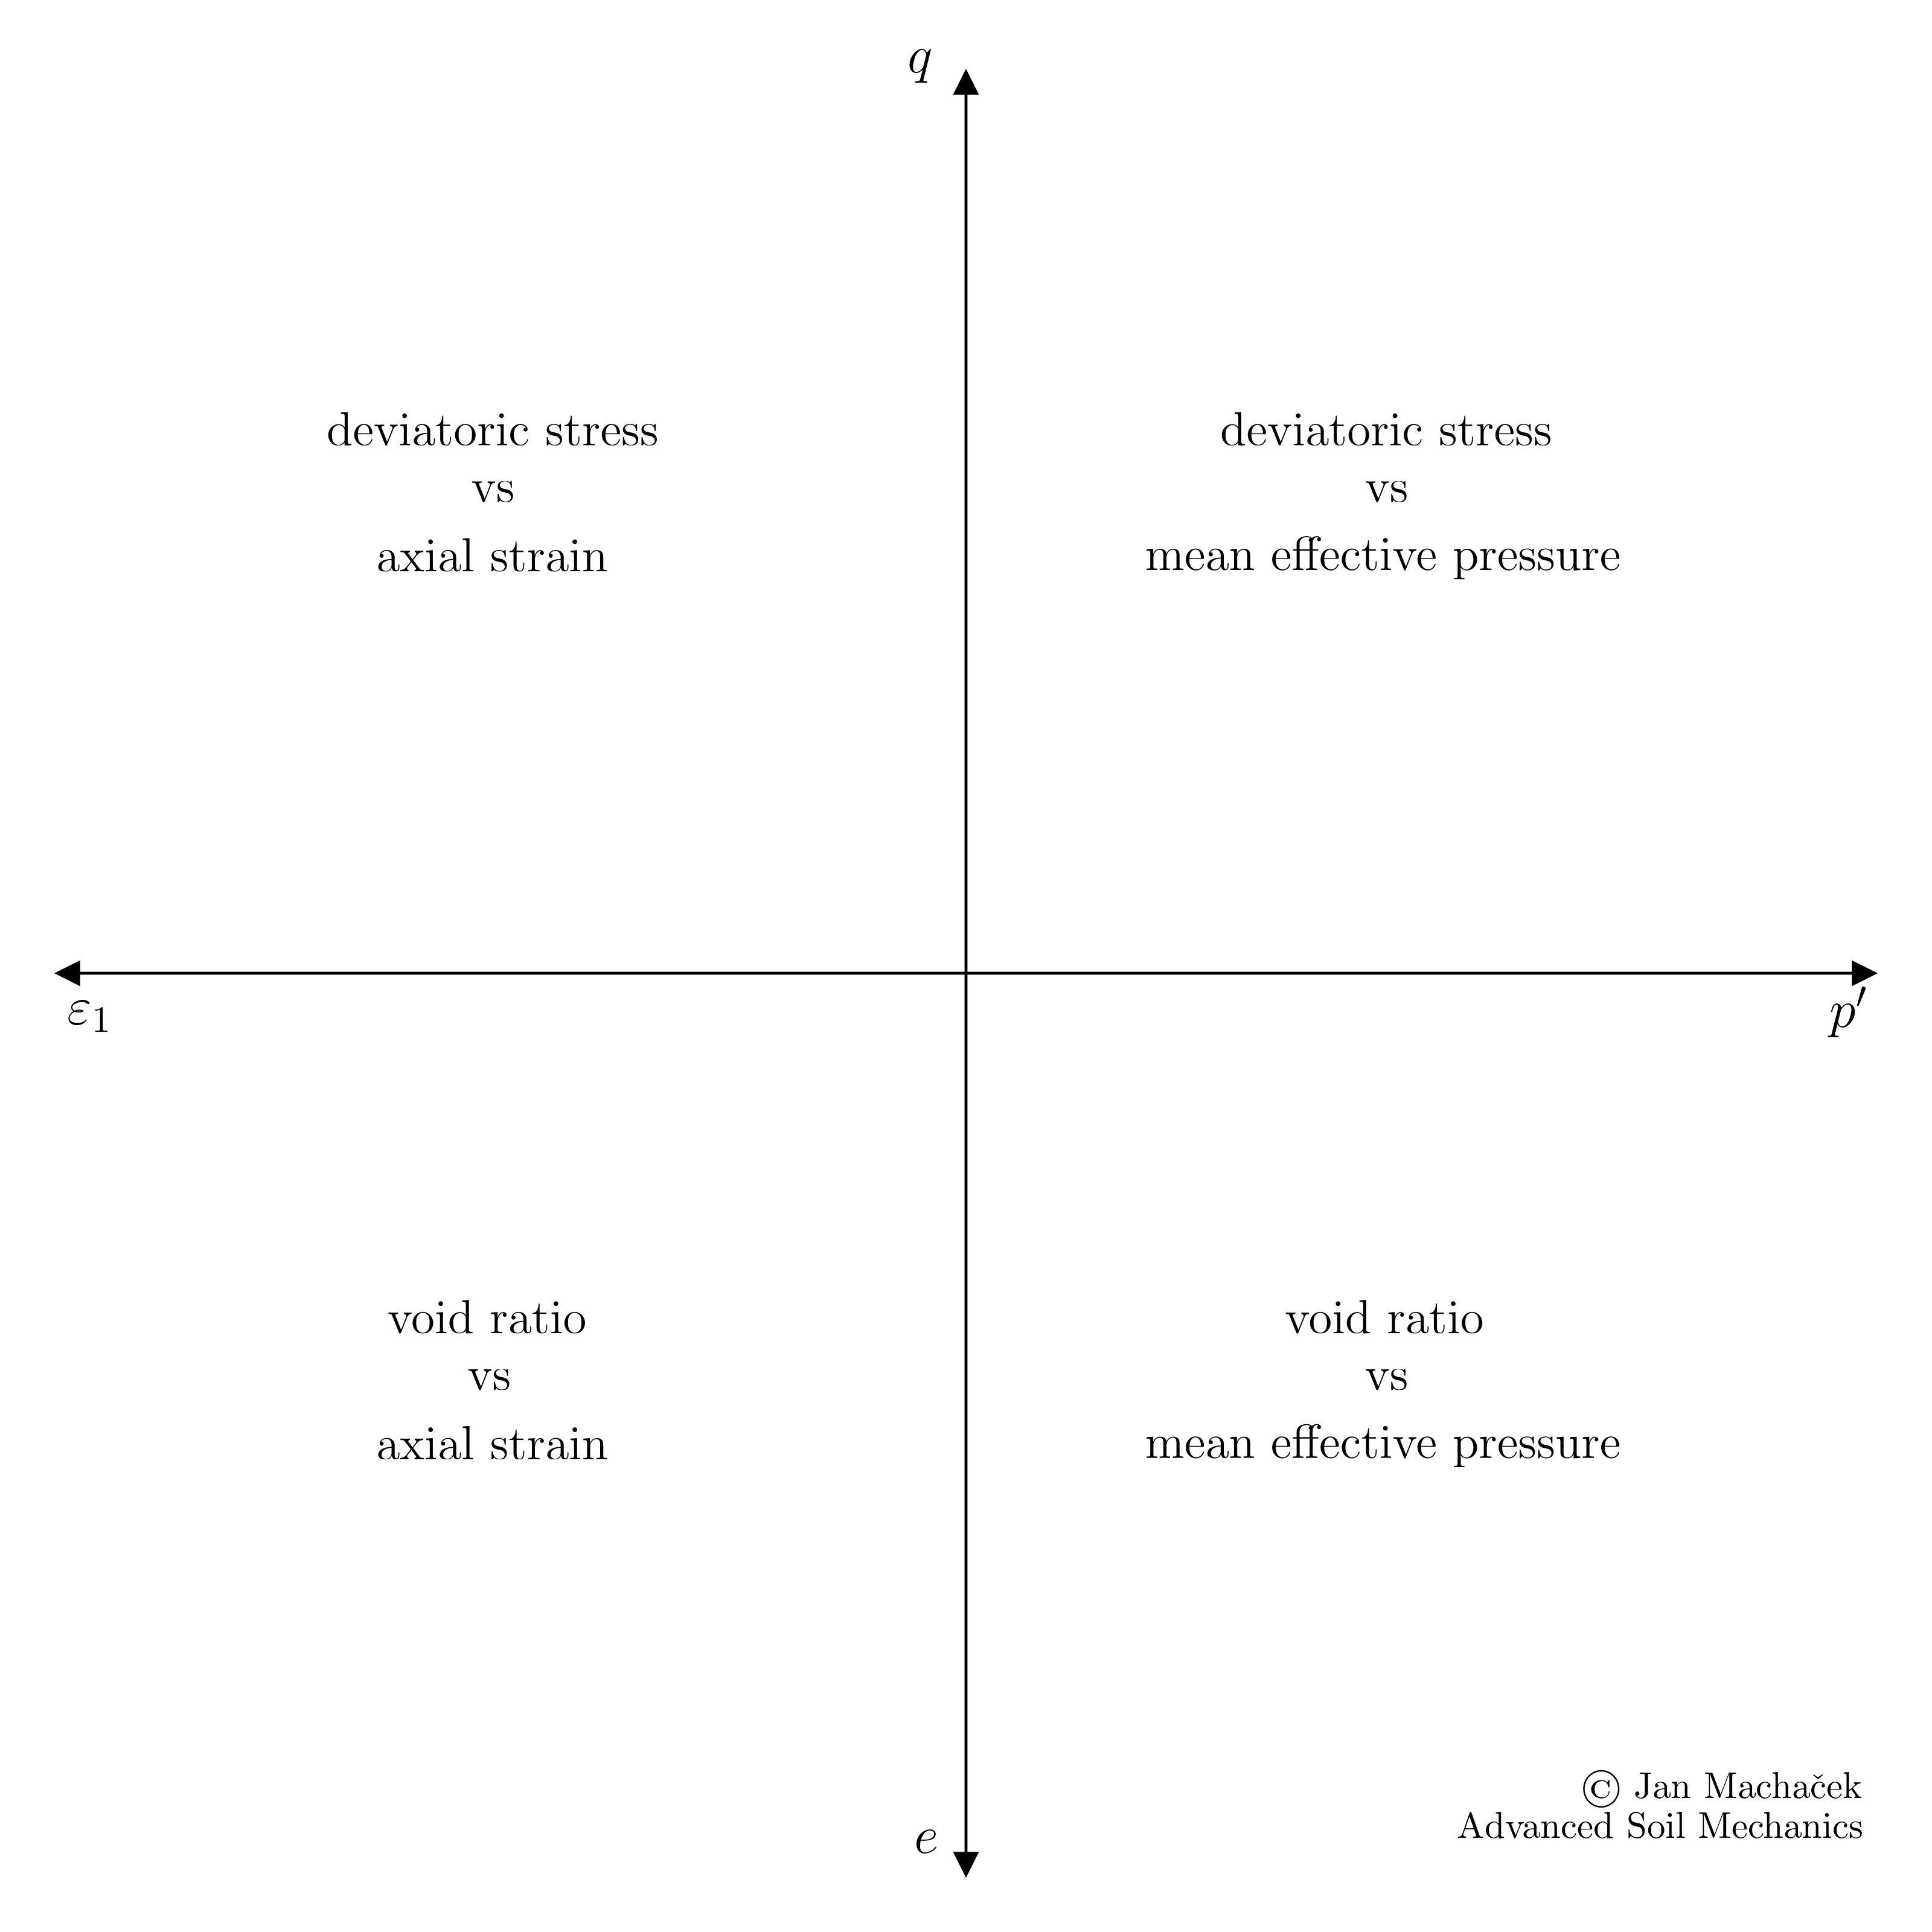
To conclude our introduction to drained monotonic triaxial tests on sand, we juxtapose the experimental results from tests on both loose and dense sand, as elaborated in the prior sections. We present these comparisons through a consolidated diagram:
- Upper left quadrant: the deviatoric stress \(q\) is plotted against axial strain \(\varepsilon_1\).
- Upper right quadrant: \(q\) is represented over the mean effective stress \(p^\prime\).
- Lower left quadrant: the relationship between the void ratio \(e\) and the axial strain \(\varepsilon_1\) is depicted.
- Lower right quadrant: the void ratio \(e\) is presented over \(p^\prime\).
Please note that common axes are scaled uniformly. A discussion of the individual frames of the animation is given below.
 Typical behaviour of loose and dense sand under drained shearing (click to play)
The animation starts with
-
the typical test results for a loose sample and
-
subsequently adds results from a dense sample. Following these,
-
the slope \(M_c\) is delineated in the \(p^\prime-q\) plane, originating from the end points of the experimental data – specifically the maximum deviatoric stress attained in the test on the loose sample and the residual deviatoric stress value from the dense sample test. The inclination \(M_c\) is related to the residual (or critical) friction angle \(\varphi_c\) by the well-established Mohr-Coulomb failure criterion:
- In a similar manner, the slope \(M_p\) is defined by connecting the \(p^\prime-q\) plane's origin to the peak deviatoric stress achieved in the dense sample. This relationship is:
-
Next, we introduce contractancy, denoting the sample's volume reduction, evident from the declining void ratio (negative \(\Delta e\)) of the loose sample.
-
In contrast, the dense sample, after a brief contractant phase, demonstrates pronounced dilatant behaviour – a volume expansion represented by a rising void ratio (positive \(\Delta e\)).
-
Next, "strain hardening" and "strain softening" are introduced. "Strain hardening" denotes the strengthening of a material by plastic deformation, here visible by the increase in \(q\) with increasing axial strain \(\varepsilon_1\). "Strain softening" on the other hand is the deterioration of material strength with increasing deformation, visible by the decay in \(q\) with increasing \(\varepsilon_1\) of the test on the dense sample.
-
The last step incorporates the anticipated or theoretical behaviour as grey notations within the laboratory test outcomes. This represents the soil behaviour under ideal circumstances – which are unfortunately never met. Such ideal conditions presume soil sample homogeneity throughout the test, indicating the absence of shear bands. Unfortunately, this criterion is seldom met in practice, especially for triaxial tests on dense samples. The formation of shear bands depends on the sample size and the density of the material as shown below
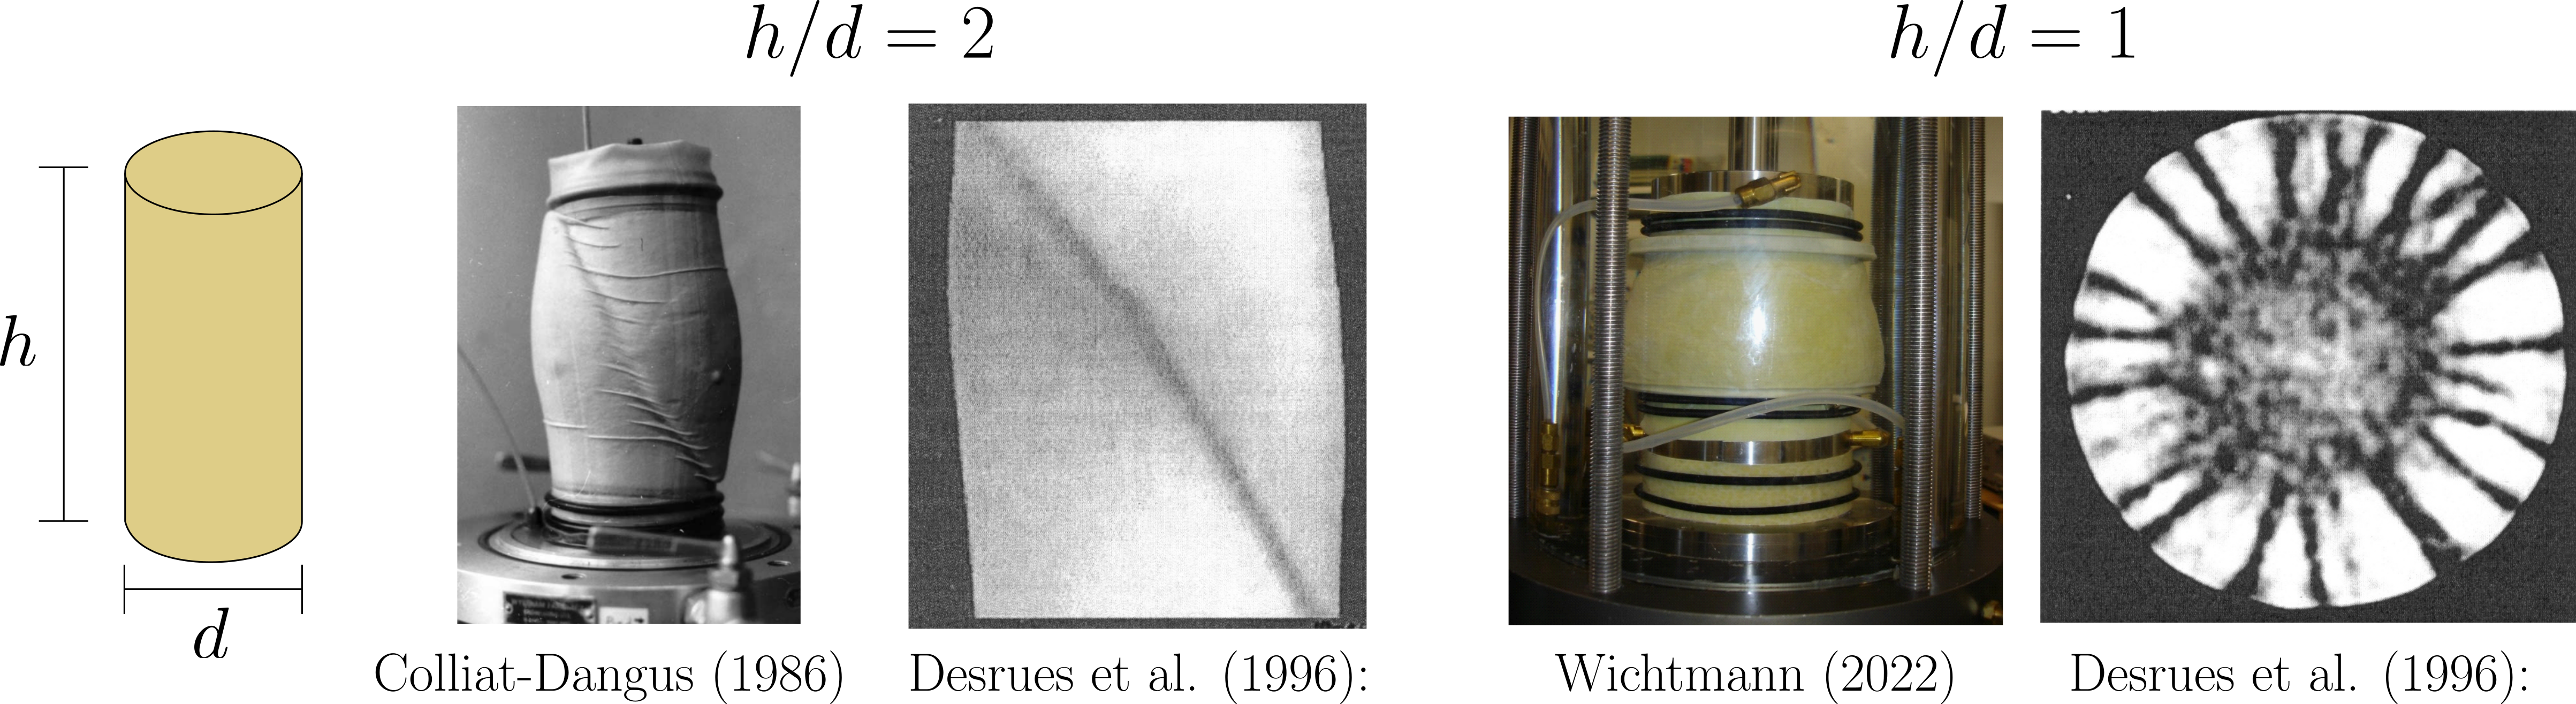
After the formation of a shear band, dilatancy only happens within a narrow range of deformation inside the shear band. It is compensated for by a slight compression in the remaining volume of the specimen, so that the total volume of the specimen remains unchanged.
Warning
It's worth noting that the above evaluation, in strict terms, is neither exhaustive nor sufficient. A comprehensive assessment of the \(M_{c/p}\) or \(\varphi_{c/p}\) requires at least three triaxial tests with varying initial mean effective stress. \(M_c\) is then deduced from the linear regression line connecting the end points of these tests. The regression line does not necessarily need to intersect the \(p^\prime-q\) plane's origin. For numerous fine-grained soils, this line intersects the \(q\)-axis at values greater than 0. The intercept, termed \(q_i\), is used to evaluate the cohesion \(c^\prime\):
-
T. Wichtmann and T. Triantafyllidis, ‘An experimental database for the development, calibration and verification of constitutive models for sand with focus to cyclic loading: part I—tests with monotonic loading and stress cycles’, Acta Geotech., vol. 11, no. 4, pp. 739–761, Aug. 2016, doi: 10.1007/s11440-015-0402-z. ↩
-
M. Budhu, Soil mechanics and foundations, 3rd ed. Hoboken, NJ: Wiley, 2011. ↩
-
D. Kolymbas, Geotechnik: Bodenmechanik, Grundbau und Tunnelbau. Berlin, Heidelberg: Springer Berlin Heidelberg, 2011. ↩