Undrained monotonic triaxial extension tests on sand
So far, we have looked at monotonic triaxial compression tests under drained and undrained conditions. In this section, we will briefly cover the basics of undrained triaxial extension tests.
Introduction
The initial stages of an undrained monotonic triaxial extension test are similar to those of the triaxial compression counterpart. Contrary to the compression test, in the extension test the radial stress \(\sigma_3\) is larger than the axial stress \(\sigma_1\) as is shown in the figure below. This can be either achieved by decreasing the axial Force \(F\) or by increasing the cell pressure \(\sigma_3\).
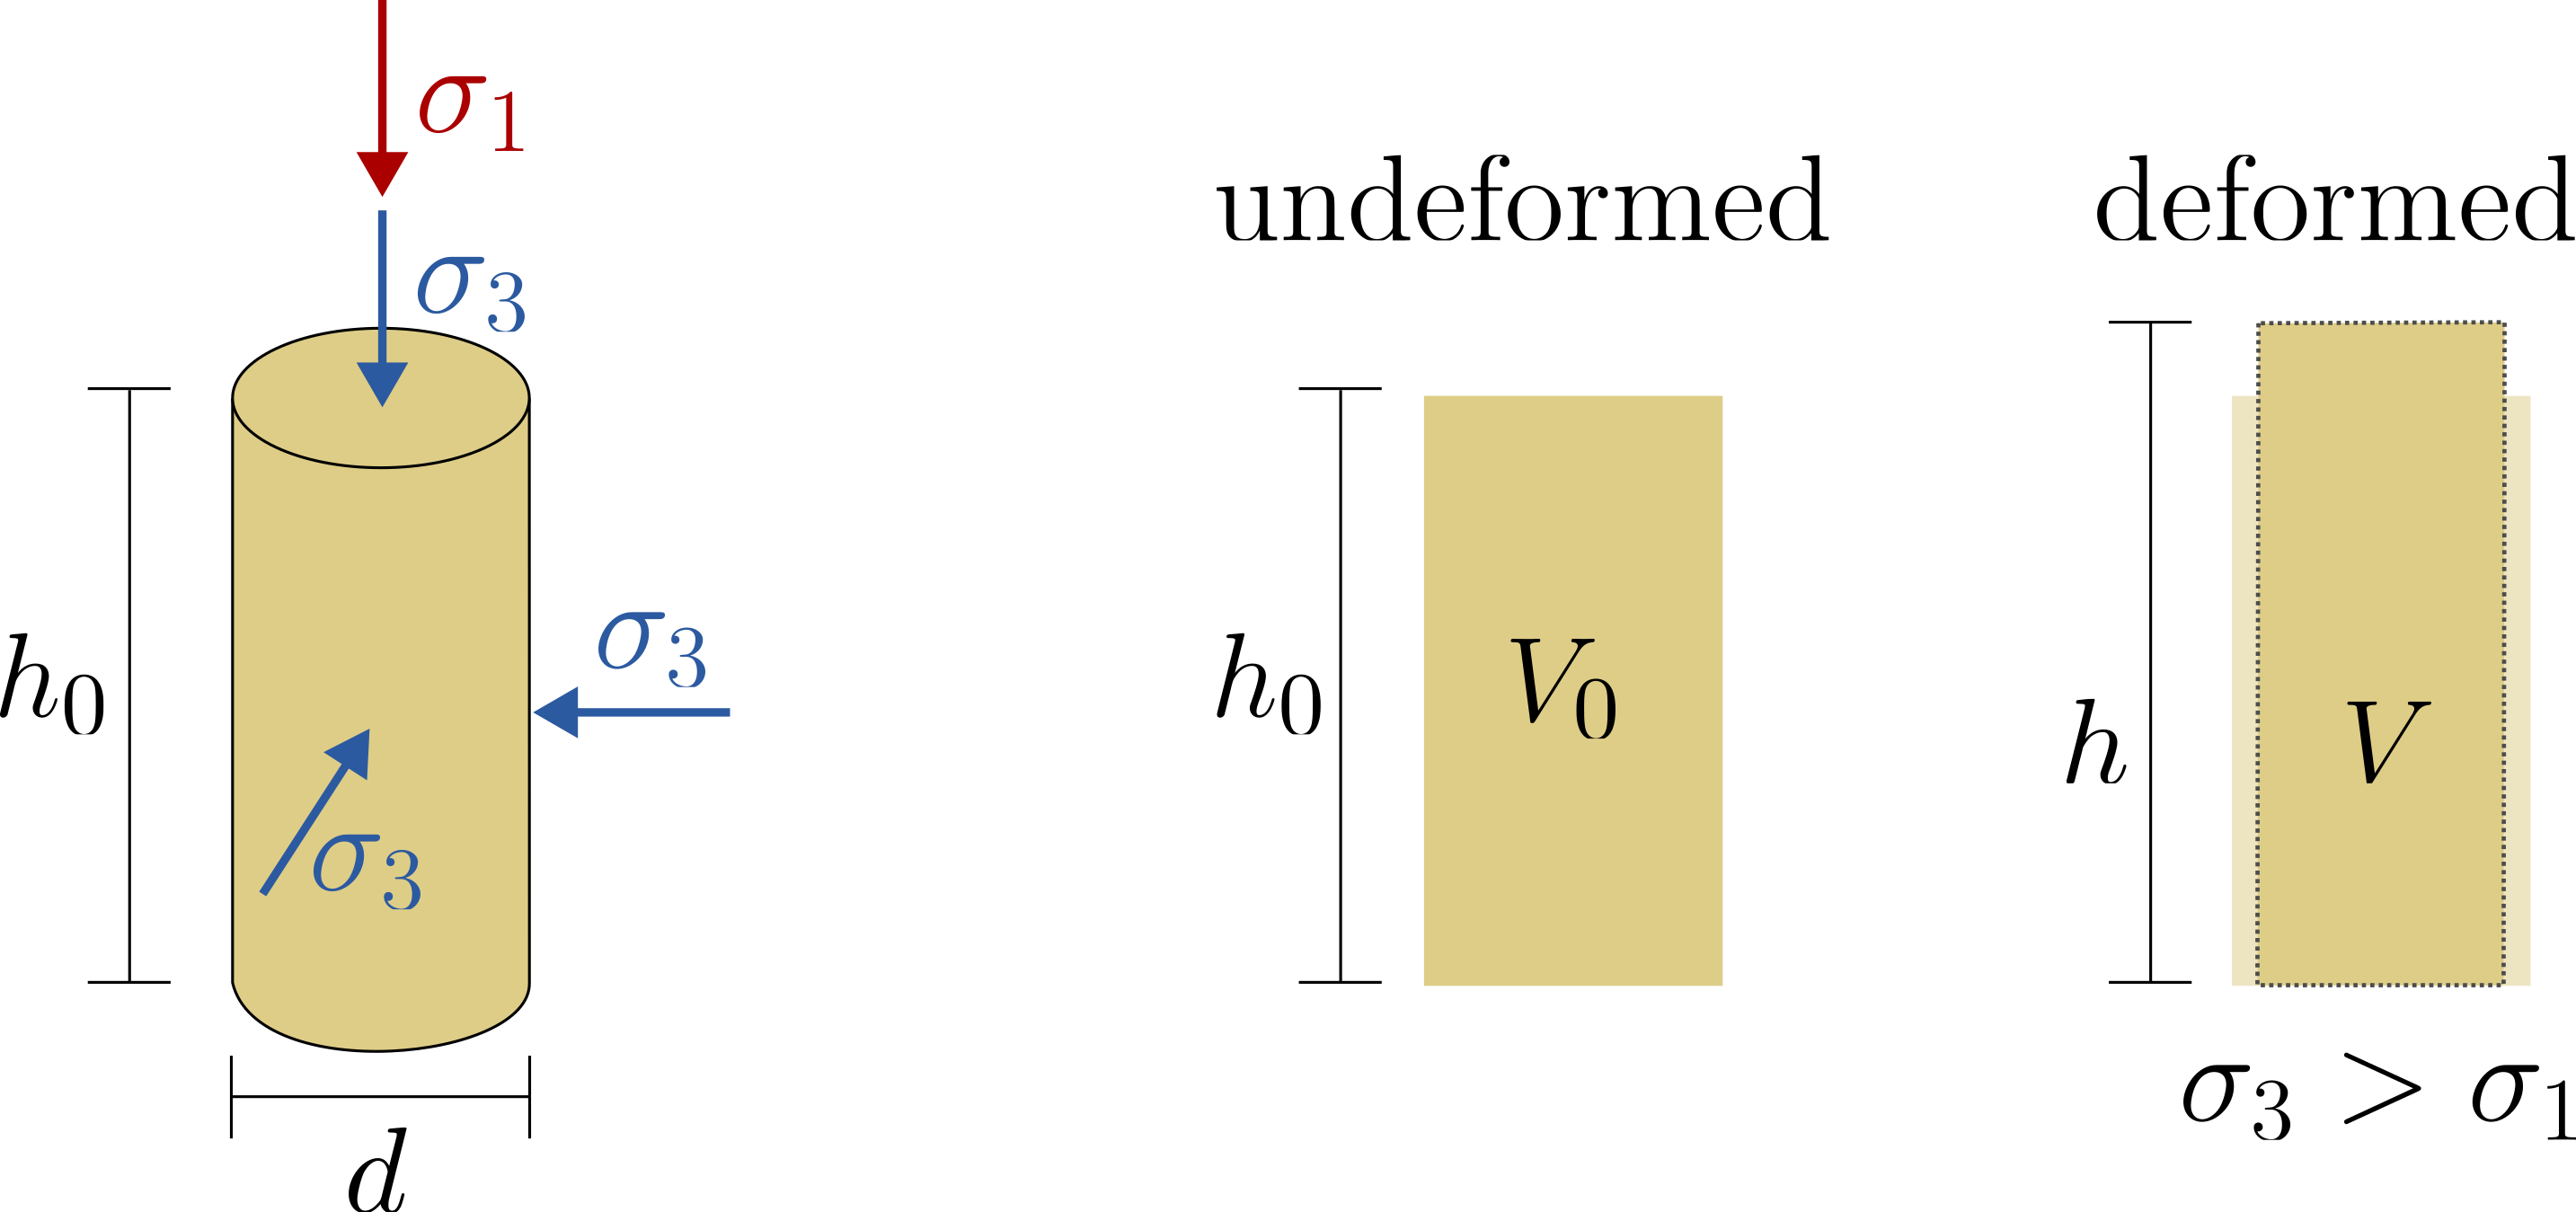
Model presentation for calculating stresses and strains during a triaxial extension test.
During the test, the axial force \(F\), the radial stress (cell pressure) \(\sigma_3\), and the pore water pressure \(p^w\) are recorded. The axial stress \(\sigma_1\) is derived from the measured axial force \(F\). Analogously to the undrained triaxial compression test, the influence of the pore water pressure needs to be taken into account:
It is worth noting that because of \(\sigma_3 > \sigma_1\), the deviatoric stress \(q\) is negative (\(q =\sigma_1 - \sigma_3 < 0\)), see explanation in Section Triaxial conditions.
Typical test results for sands with different initial densities
Typical results of undrained triaxial extension tests for three different loose, medium dense and dense sands at same initial mean effective pressure \(p^\prime_0\) are shown in below animation. For comparison, the results of undrained triaxial compression tests at the same initial densities and \(p^\prime_0\) are included.
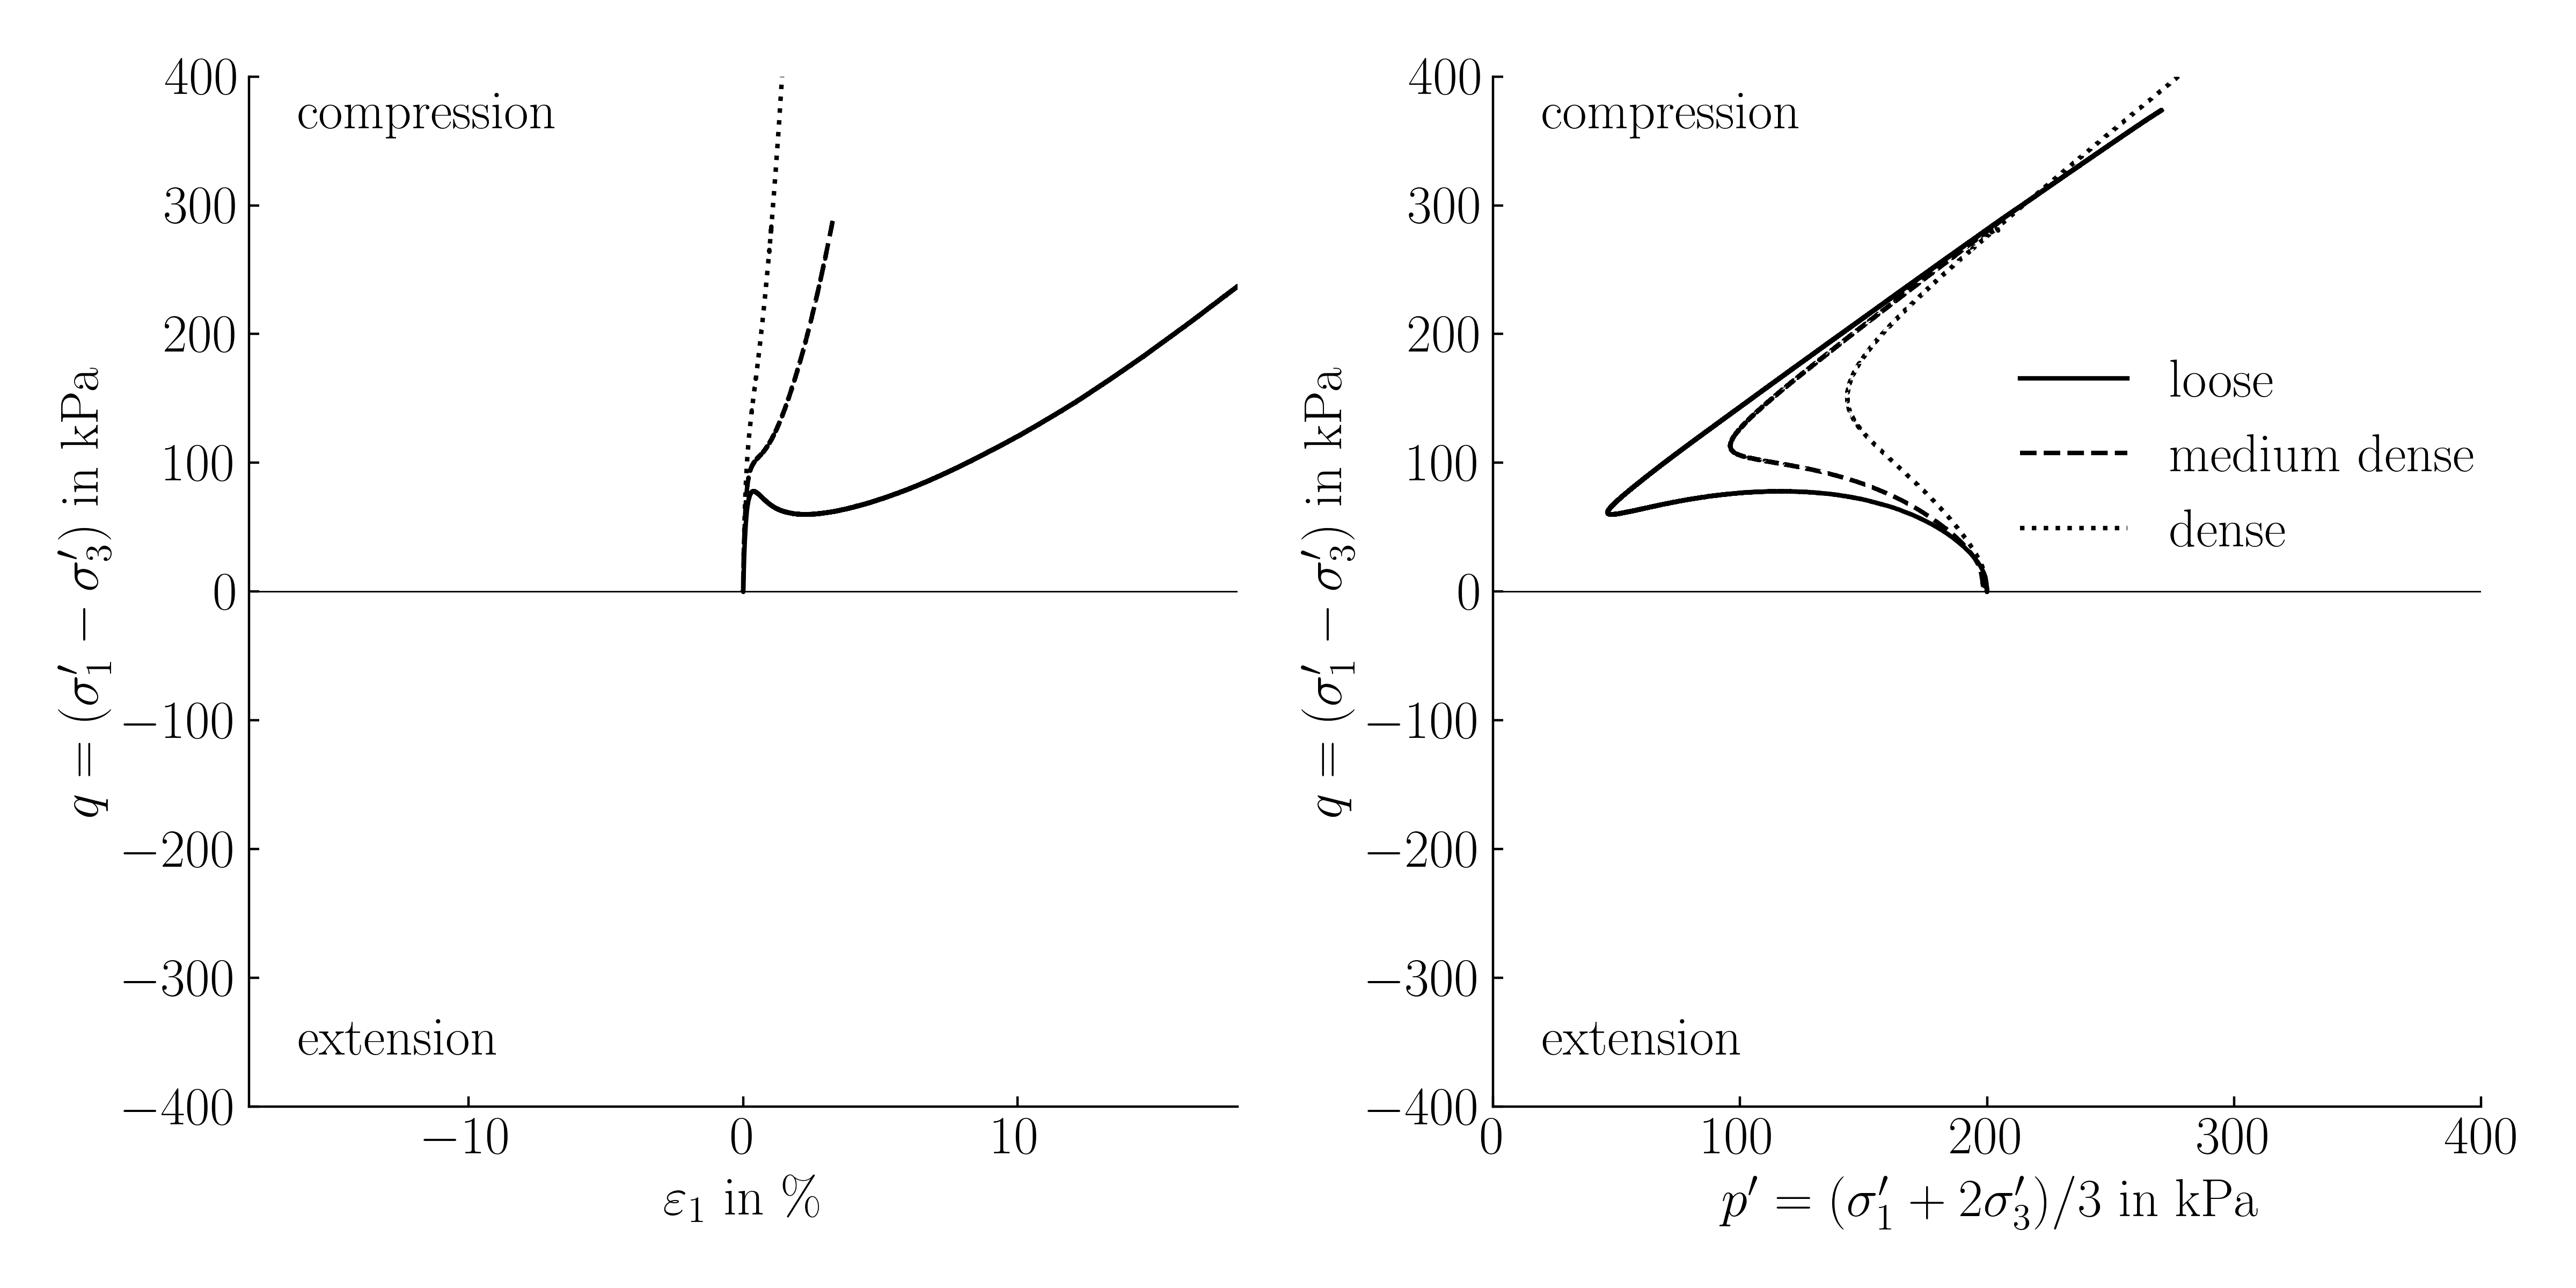 Typical results of undrained monotonic triaxial extension tests on sand in the \(\varepsilon_1-q\) plane and \(p^\prime-q\) plane, experimental data from 1 (click to play)
- At the beginning, the animation displays the test results of three undrained triaxial compression tests, showing the characteristic behaviour of loose, medium dense, and dense sands during undrained shearing. These results serve as a reference for evaluating the undrained triaxial extension tests.
- Subsequently, the results of three undrained triaxial extension tests are added to the plot, one after the other. It becomes immediately evident that the deviatoric stress \(q\) is negative due to the radial stress (cell pressure) being larger than the axial stress (\(\sigma_3 > \sigma_1\)). A detailed explanation of why \(q\) can be negative is provided in Section Triaxial Conditions. The increase in the height of the sample, which leads to negative axial strain \(\varepsilon_1\), is observed.
- Apart from the change in sign in \(q\) and \(\varepsilon_1\) the soil behaviour is very similar to the behaviour observed in the undrained triaxial compression tests. However, having a closer look, we can observe that under extension sand, at same density and mean effective pressure, has a smaller shear strength compared to compression. For example, the loose sand sample reaches a maximum deviatoric stress of approximately 80 kPa in compression before a significant decrease in mean effective pressure and deviatoric stress occurs. In contrast, under extension loading, the maximum deviatoric stress for the loose sand sample is only about 60 kPa. The reason for the reduced shear strength is that the development of shear bands is facilitated by the rotation of the principal stresses (the radial stress is now larger than the axial stress)2.
-
Similar to the triaxial compression tests, a linear relation between the shear strength and the mean effective pressure is apparent in extension tests. However, the inclination \(M_e\) of the linear regression in extension tests is observed to be smaller than the inclination \(M_c\) in compression. Similar to \(M_c\), \(M_e\) is related to the residual (or critical) friction angle \(\varphi_c\):
\(M_e = -\dfrac{6\sin{\varphi_c}}{3+\sin{\varphi_c}}\)
-
T. Wichtmann and T. Triantafyllidis, ‘An experimental database for the development, calibration and verification of constitutive models for sand with focus to cyclic loading: part I—tests with monotonic loading and stress cycles’, Acta Geotech., vol. 11, no. 4, pp. 739–761, Aug. 2016, doi: 10.1007/s11440-015-0402-z. ↩
-
M. Yoshimine, K. Ishihara, and W. Vargas, ‘Effects of Principal Stress Direction and Intermediate Principal Stress on Undrained Shear Behavior of Sand’, Soils and Foundations, vol. 38, no. 3, pp. 179–188, Sep. 1998, doi: 10.3208/sandf.38.3_179. ↩