Undrained monotonic triaxial tests on sand
Introduction
The initial stages of an undrained monotonic triaxial test align with those of the drained variant. The sample is first consolidated to a predetermined initial stress state, followed by shearing initiated by pushing down the top cap. The distinctive feature of the undrained test is that the drainages are sealed during the shearing phase, but remain open during consolidation.
During the test, the axial force \(F\) and the radial stress (cell pressure) \(\sigma_3^\prime\) are recorded. From the measured axial force \(F\), the axial stress \(\sigma_1^\prime\) is derived. Unlike the drained test where volume change \(\Delta V\) is observed, in the undrained test, owing to the sealed drainages, no water can flow into or out of the sample. Consequently, no volume change is recorded, but instead, the pore water pressure \(p^w\) is closely monitored.
In line with the effective stress concept, when we evaluate the test measurements, we take into account the influence of the pore water pressure on the stress that dictates the soil's behaviour:
Analysis of undrained triaxial tests typically showcases the deviatoric stress \(q\) plotted against either the axial strain \(\varepsilon_1\) or the mean effective pressure \(p^\prime\). Due to the closed drainages and the inherent incompressibility of water under near-perfect water saturation conditions, no volume change \(\varepsilon_v\) (and hence no change in void ratio \(e\)) is anticipated in these tests. Typical results from undrained triaxial compression tests on both loose and dense sand samples will be presented in subsequent sections.
Consolidated vs. unconsolidated samples
The procedure described above refers to a consolidated undrained triaxial compression test. However, for undrained triaxial tests, often unconsolidated tests are performed. In the latter, shearing under undrained conditions occurs without any prior consolidation. This approach is commonly used for fine-grained soils like clays or claystones, wherein (relatively) undisturbed samples are extracted in-situ for subsequent lab testing. These tests are used to determine the undrained shear strength of the material. However it should be noted that these tests bear the inherent uncertainty about the actual amount of disturbance of the sample and its degree of saturation before the shearing. Especially the latter significantly influences the material's behaviour under undrained shearing.
Triaxial test on a loose sand sample
The animation below provides a visual representation of a typical undrained monotonic triaxial test performed on a very loose sand sample (\(D_{r0}\approx 10\) %). It displays the relationship between the deviatoric stress \(q\) and the axial strain \(\varepsilon_1\) on the left, and the deviatoric stress in connection with the mean effective pressure \(p^\prime\) on the right.
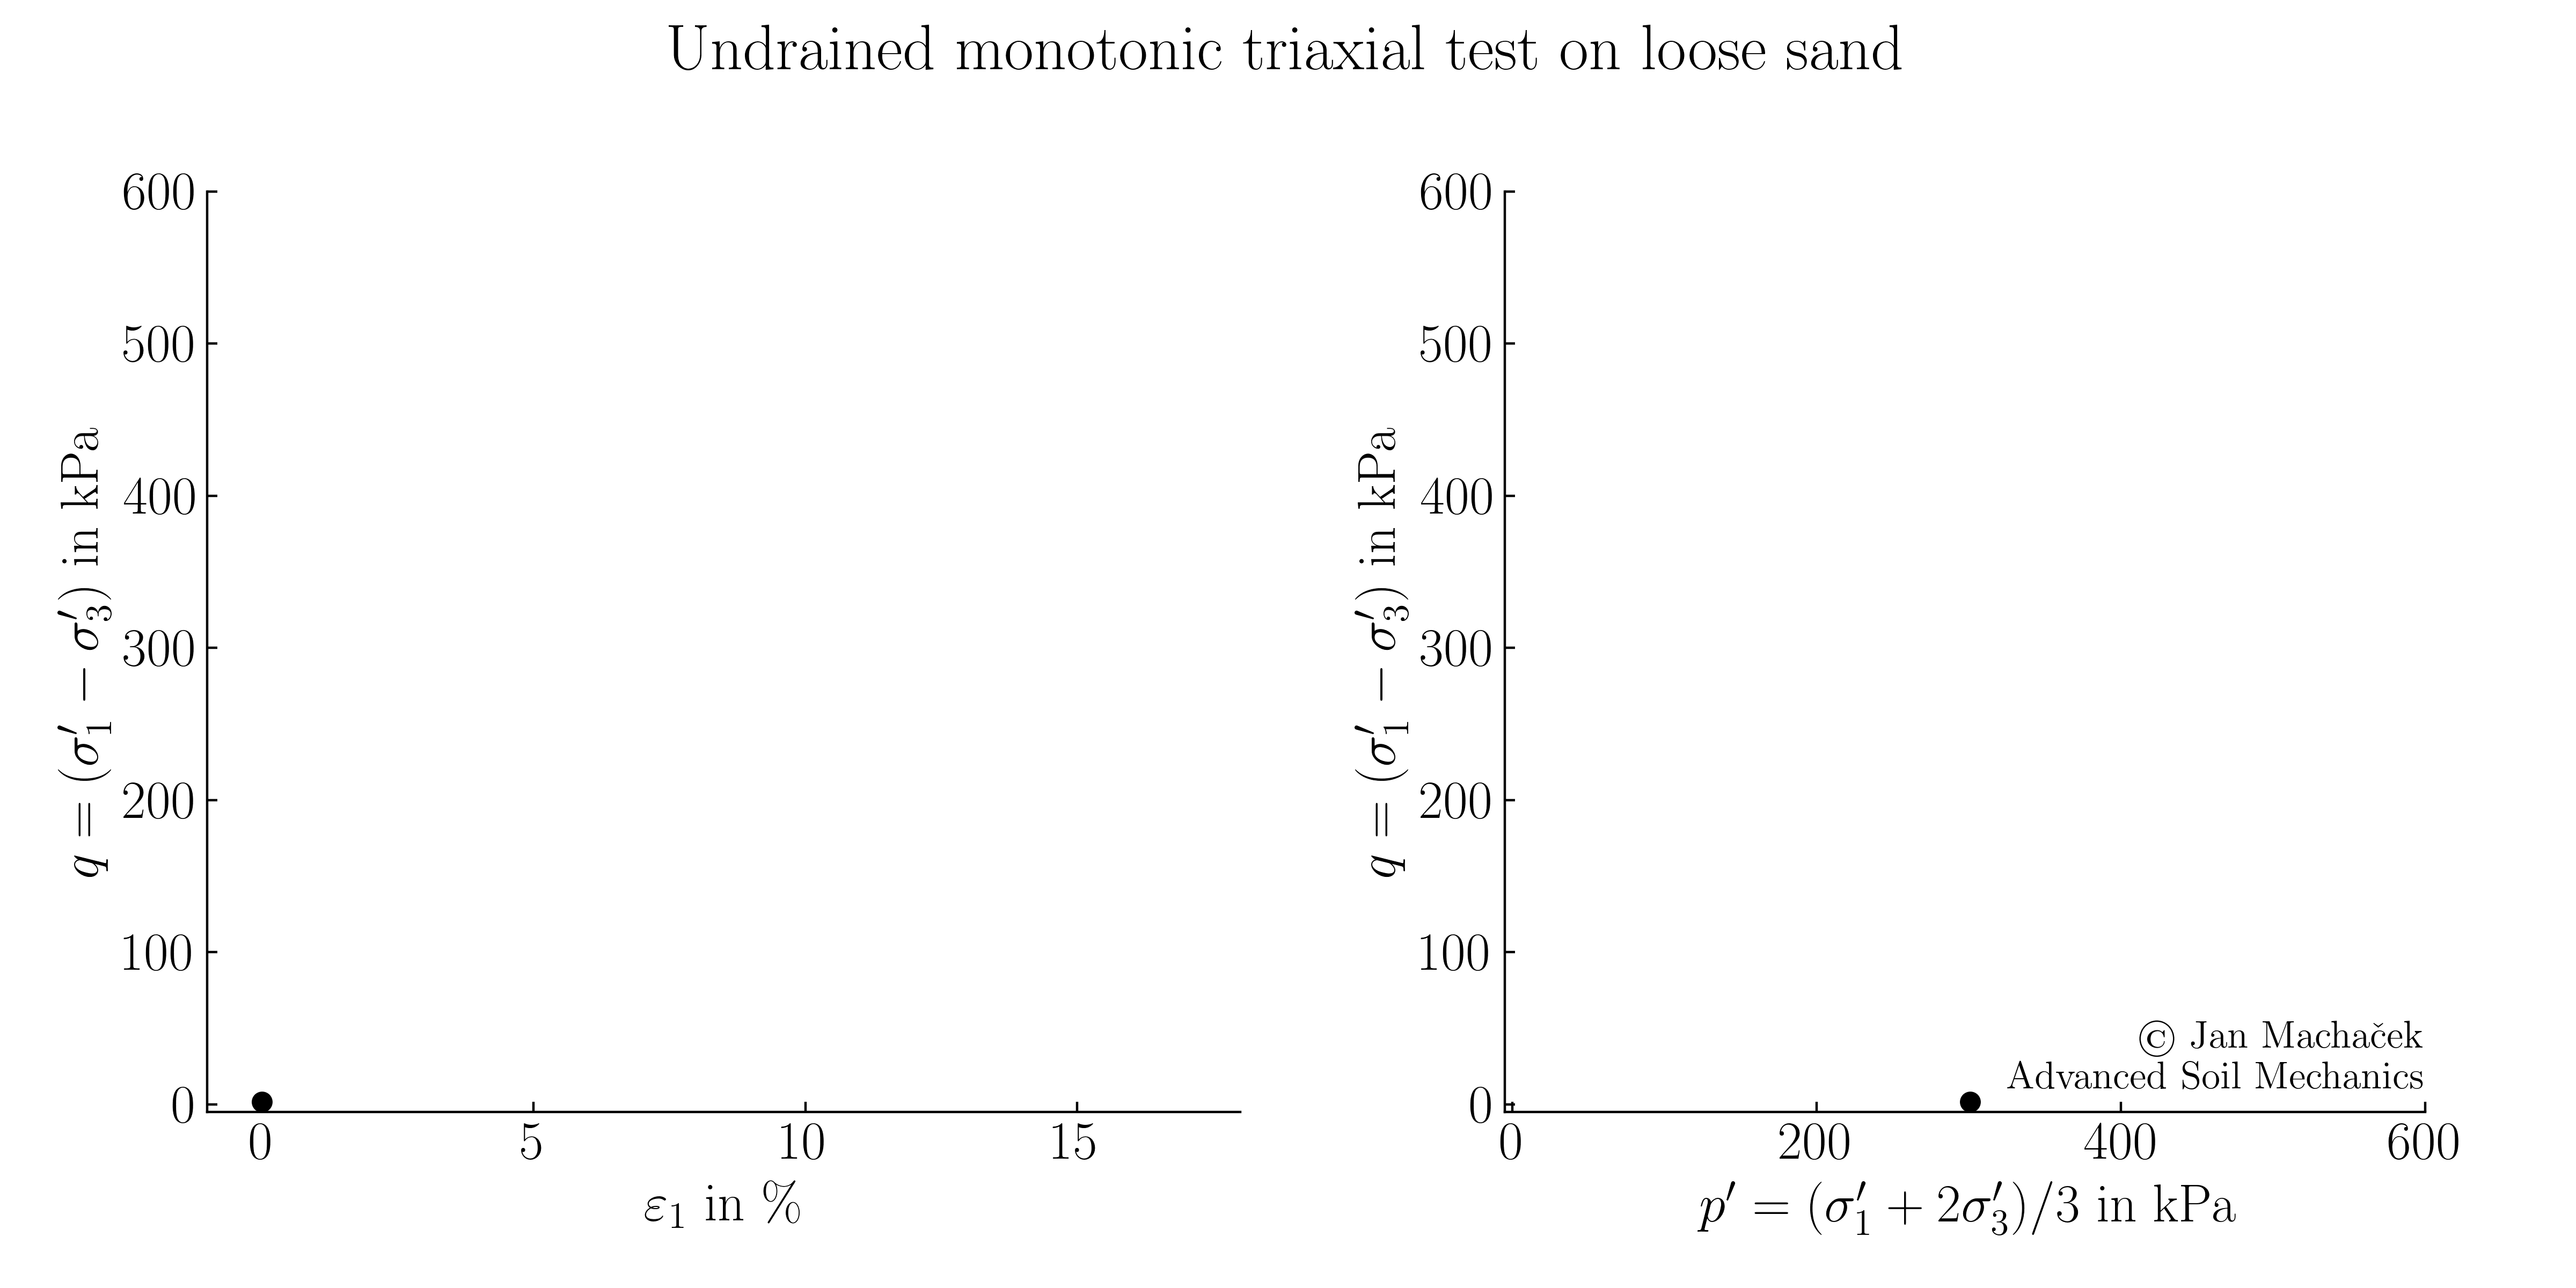 Typical results of an undrained monotonic triaxial test on loose sand (\(D_{r0}\approx 10\) %) in the \(\varepsilon_1-q\) plane and \(p^\prime-q\) plane, experimental data from 1 (click to play)
Above animation shows first an increase of deviatoric stress \(q\) with increasing axial strain \(\varepsilon_1\). However, as shearing continues, the deviatoric stress \(q\) suddenly starts to decrease and asymptotically approaches its residual value. In this later part of the test, no significant change in \(q\) is observed for increasing \(\varepsilon_1\) and is thus named "steady state". In the \(p^\prime-q\) plane, the resulting stress path is first nearly vertical, but then starts to bend to the left and tends towards the origin of the \(p^\prime-q\) plane. This relaxation of mean effective pressure \(p^\prime\) is in accordance with the contractive behaviour of the loose sample observed under drained conditions.
Triaxial test on a dense sand sample
Much like the contrast observed between loose and dense sand in drained triaxial tests, the behaviour of dense samples under undrained shearing conditions differs markedly from that of its loose counterpart. During the test's early stages, the deviatoric stress \(q\) showcases an almost linear rise in the \(\varepsilon_1-q\) plane. As the test progresses, although the growth rate of \(q\) decreases, \(q\) continues to increase, unlike the behaviour observed in the loose sample.
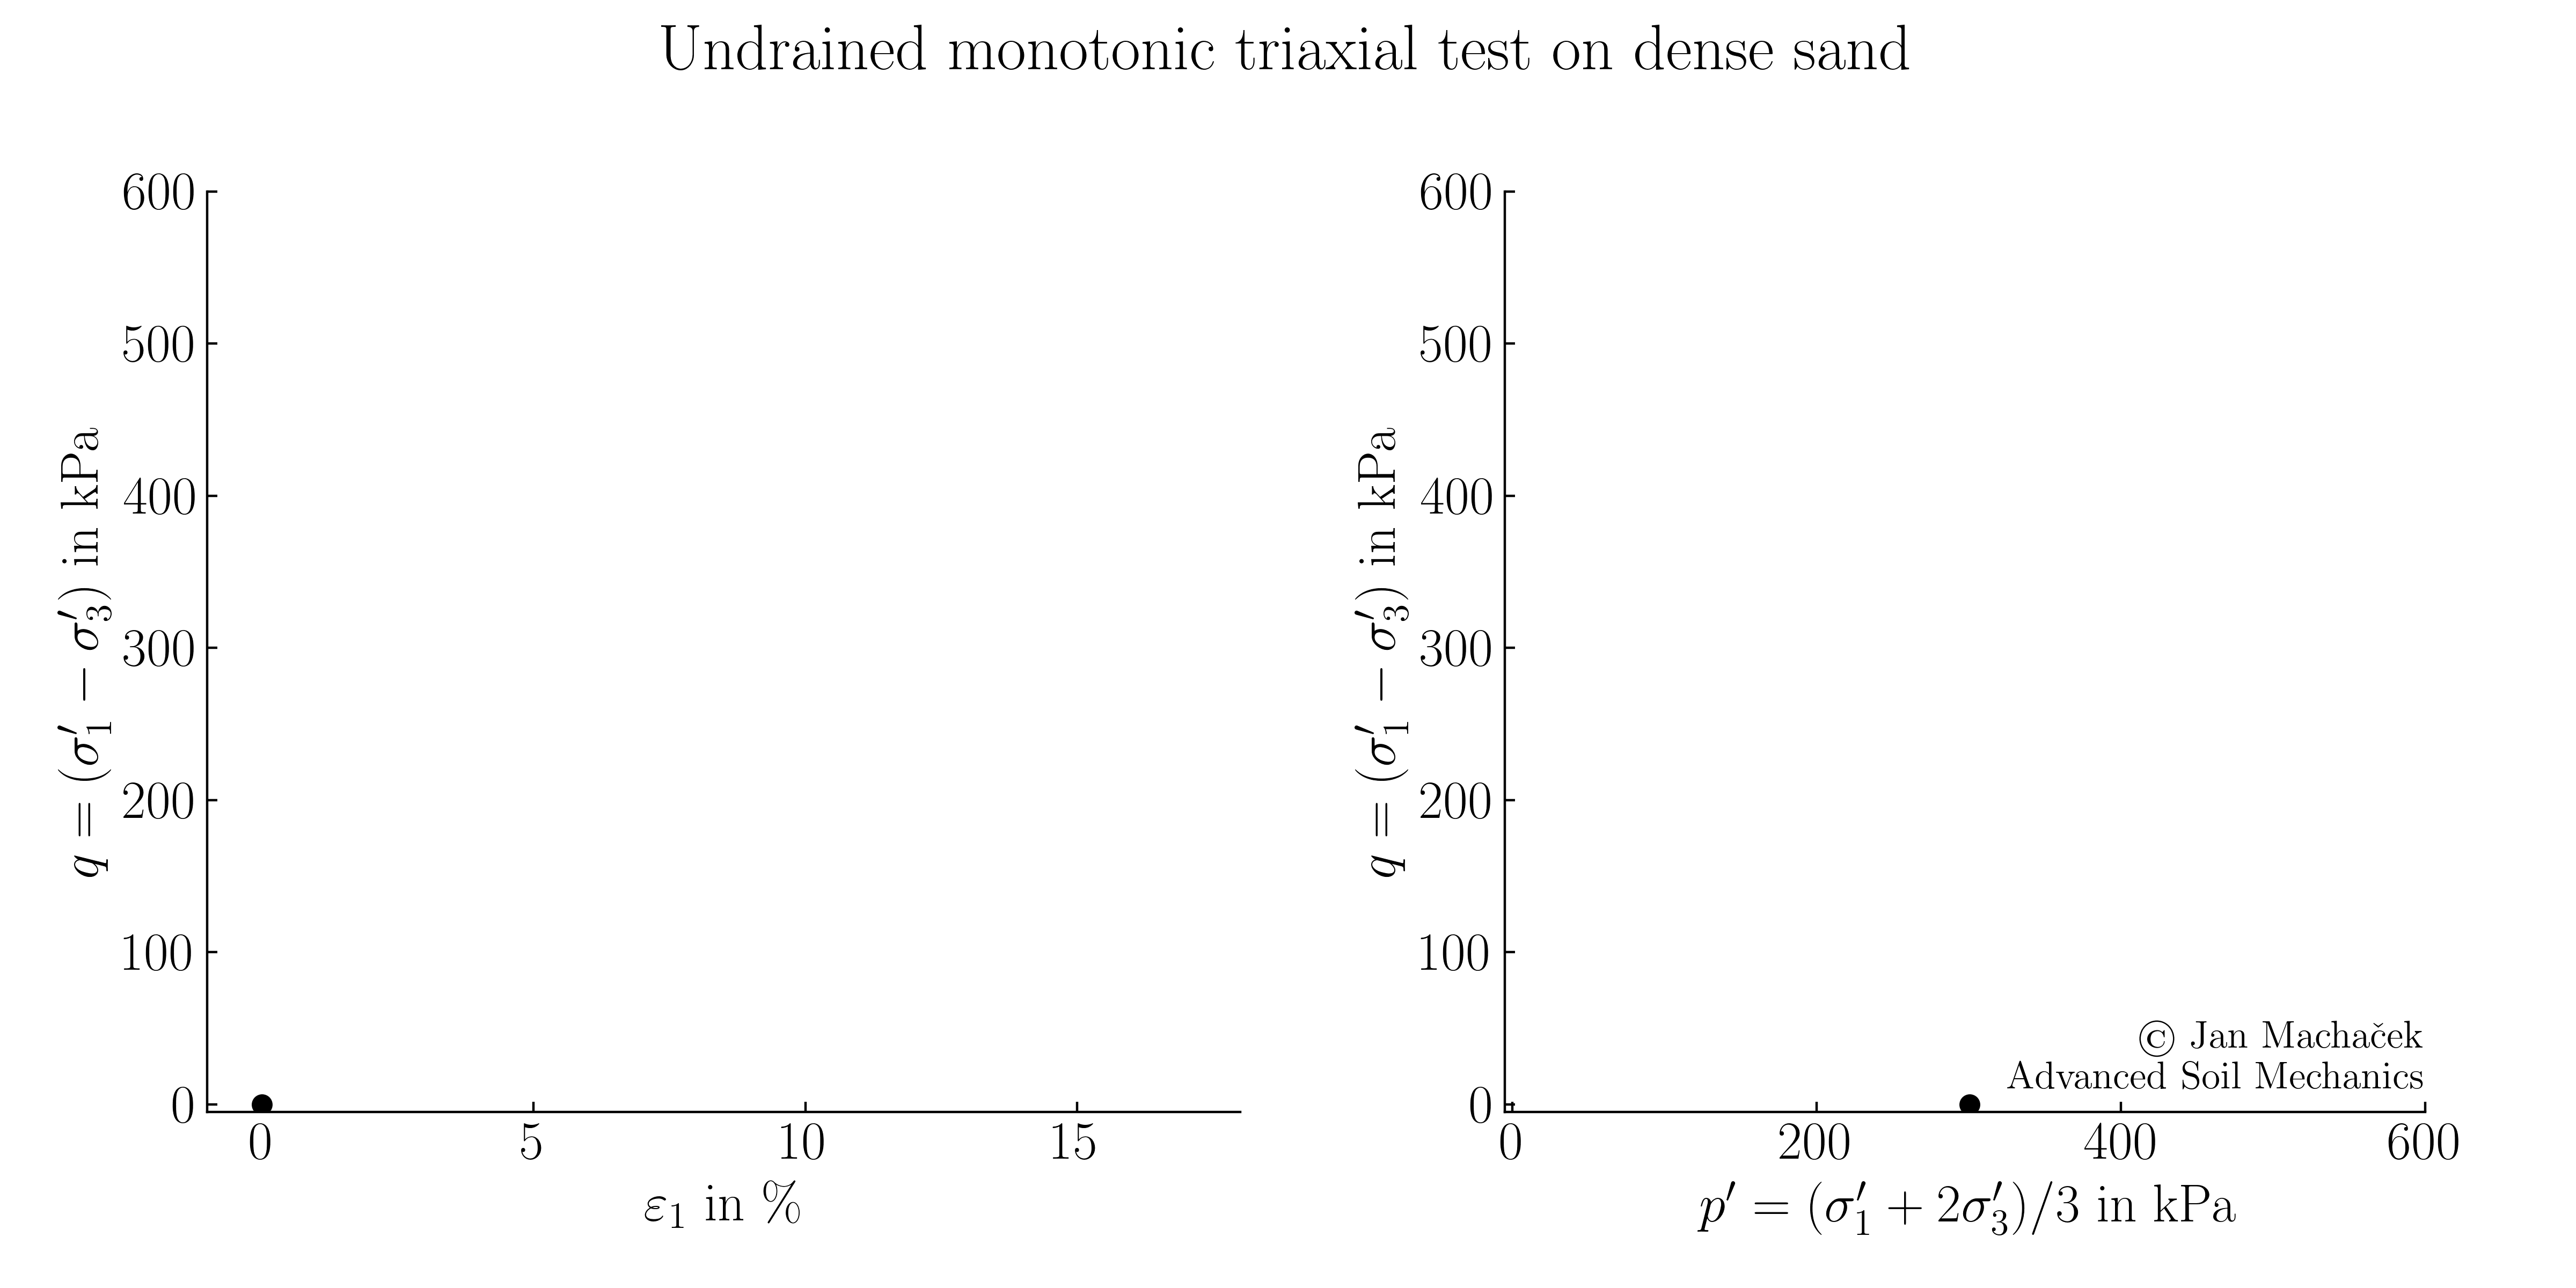 Typical results of an undrained monotonic triaxial test on dense sand in the \(\varepsilon_1-q\) plane and \(p^\prime-q\) plane, experimental data from 1 (click to play)
In the \(p^\prime-q\) plane, the stress path looks initially similar to the one of the loose sample, after a first nearly vertical start, a decrease in \(p^\prime\) with increasing \(q\) is observed. Contrary to the loose sample, no decrease in \(q\) is apparent. As shearing continues, a simultaneous increase in both the deviatoric stress \(q\) and the mean effective pressure \(p^\prime\) is evident, causing the stress path to curve rightwards.
Triaxial test on a medium dense sand sample
Typical results for medium dense sand samples (here \(D_{r0}\) is slightly above 30 %) are illustrated in below animation.
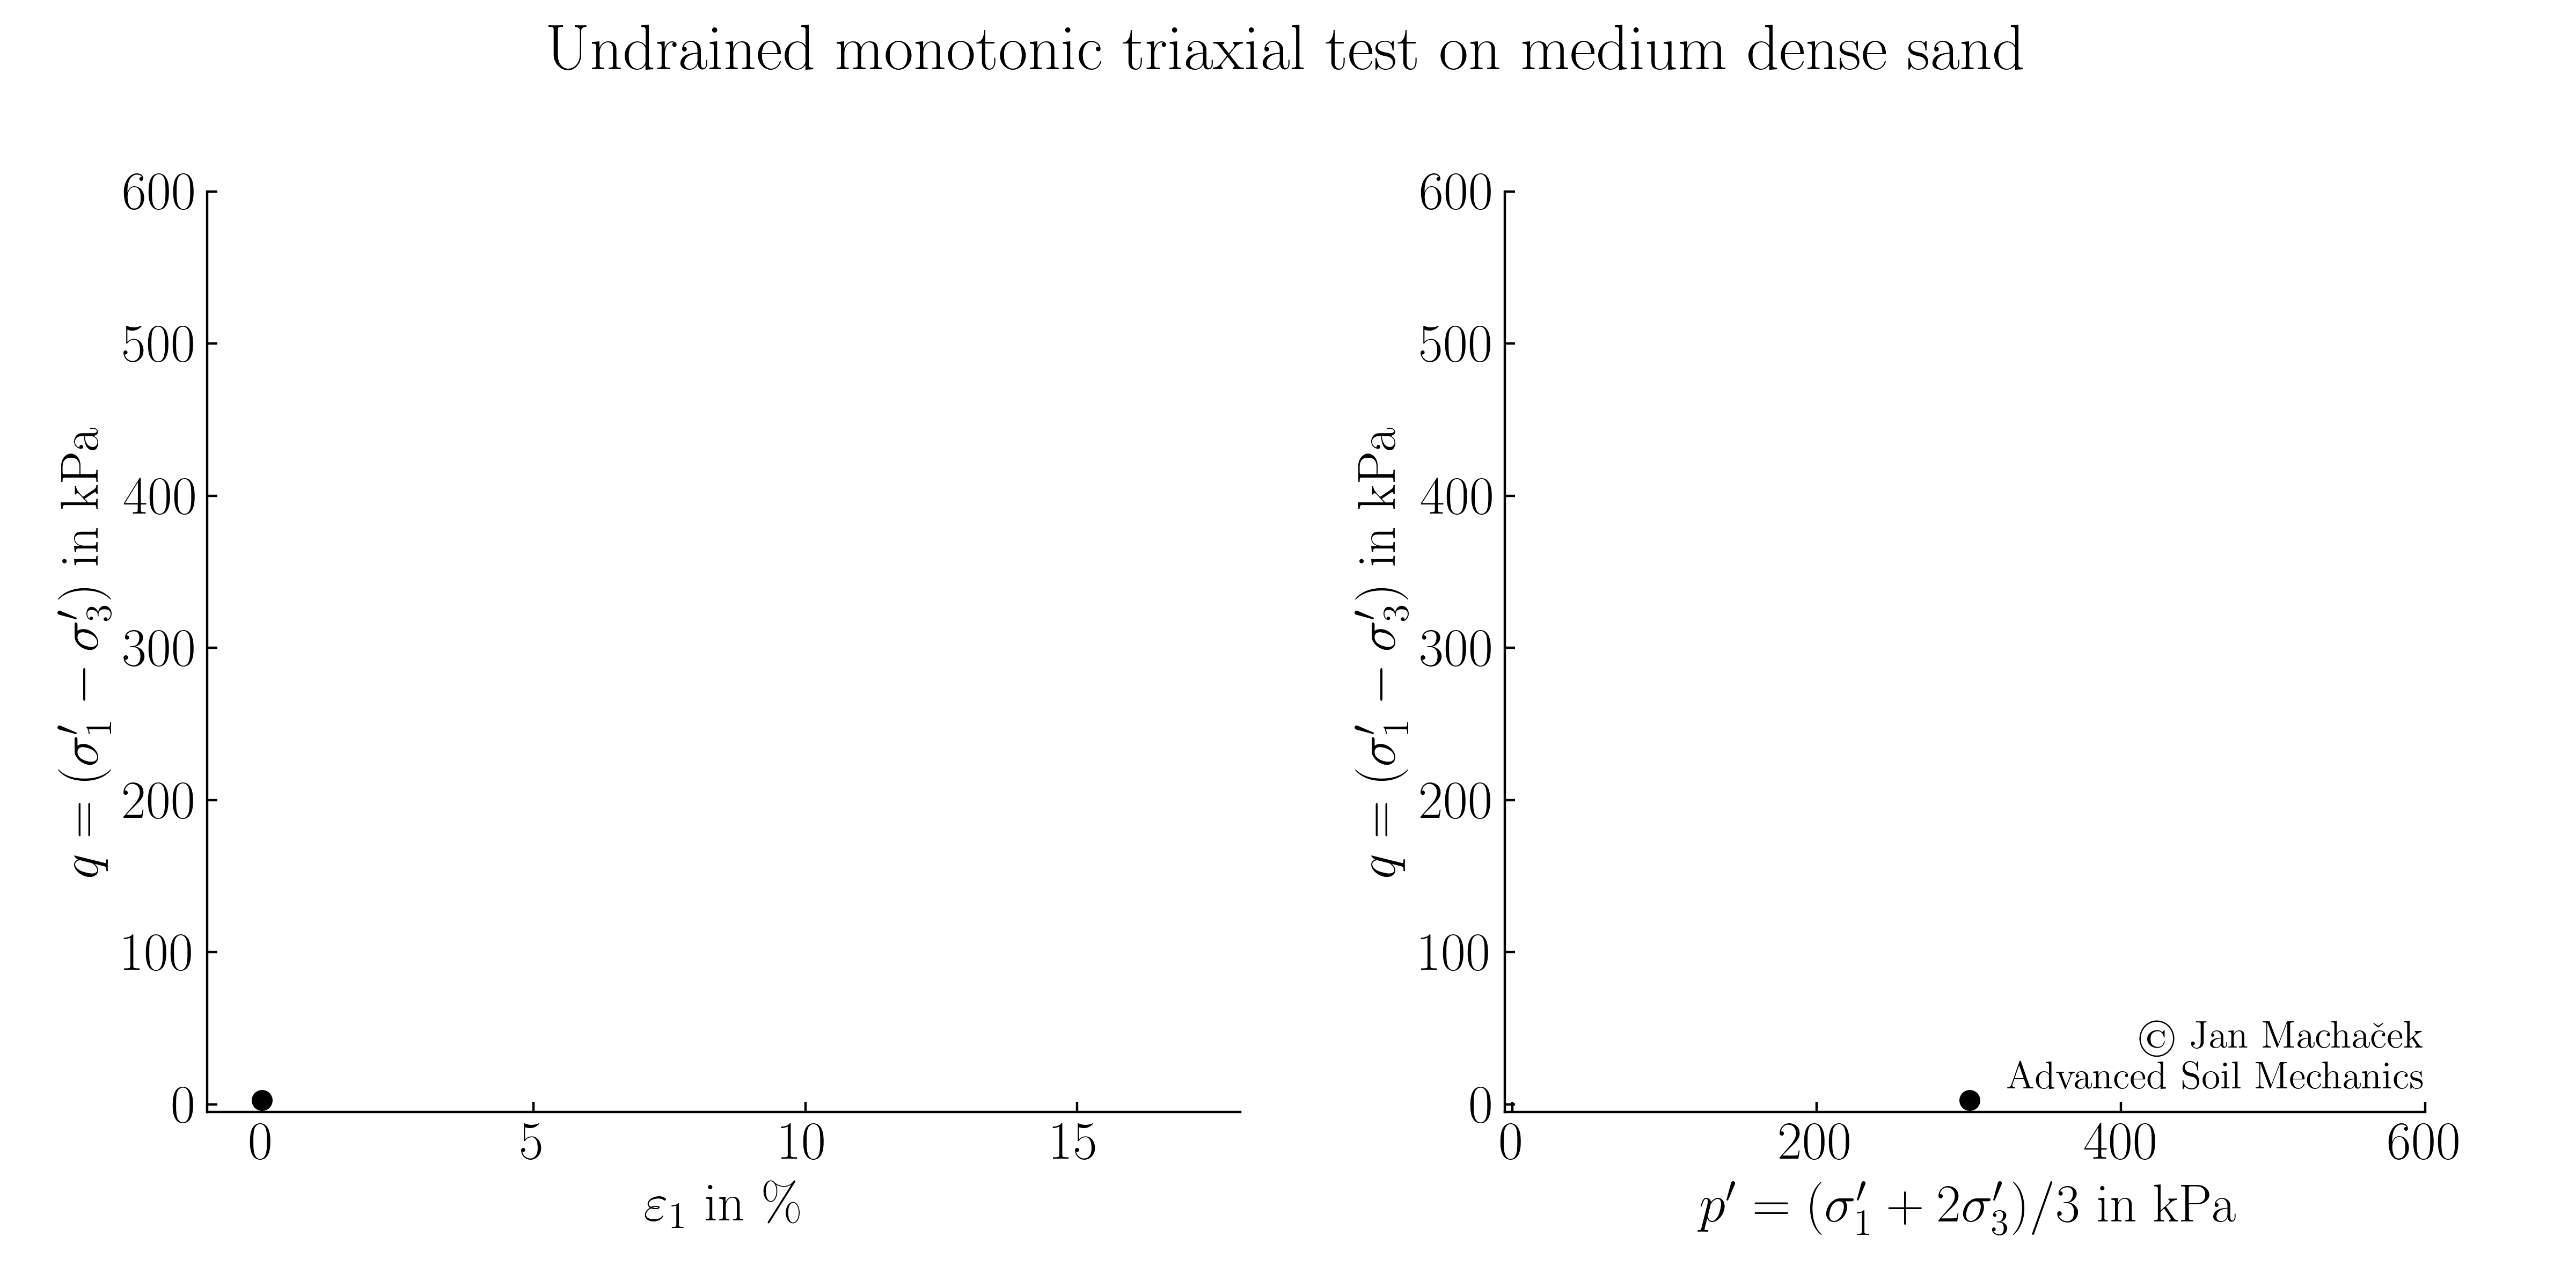 Typical results of an undrained monotonic triaxial test on medium dense sand in the \(\varepsilon_1-q\) plane and \(p^\prime-q\) plane, experimental data from1 (click to play)
Summary
To conclude our introduction to undrained monotonic triaxial tests on sand, we juxtapose the experimental results from tests on loose and dense and medium dense sand, as elaborated in the prior sections. We present these comparisons through one consolidated diagram. A discussion of the individual frames of the animation is given below.
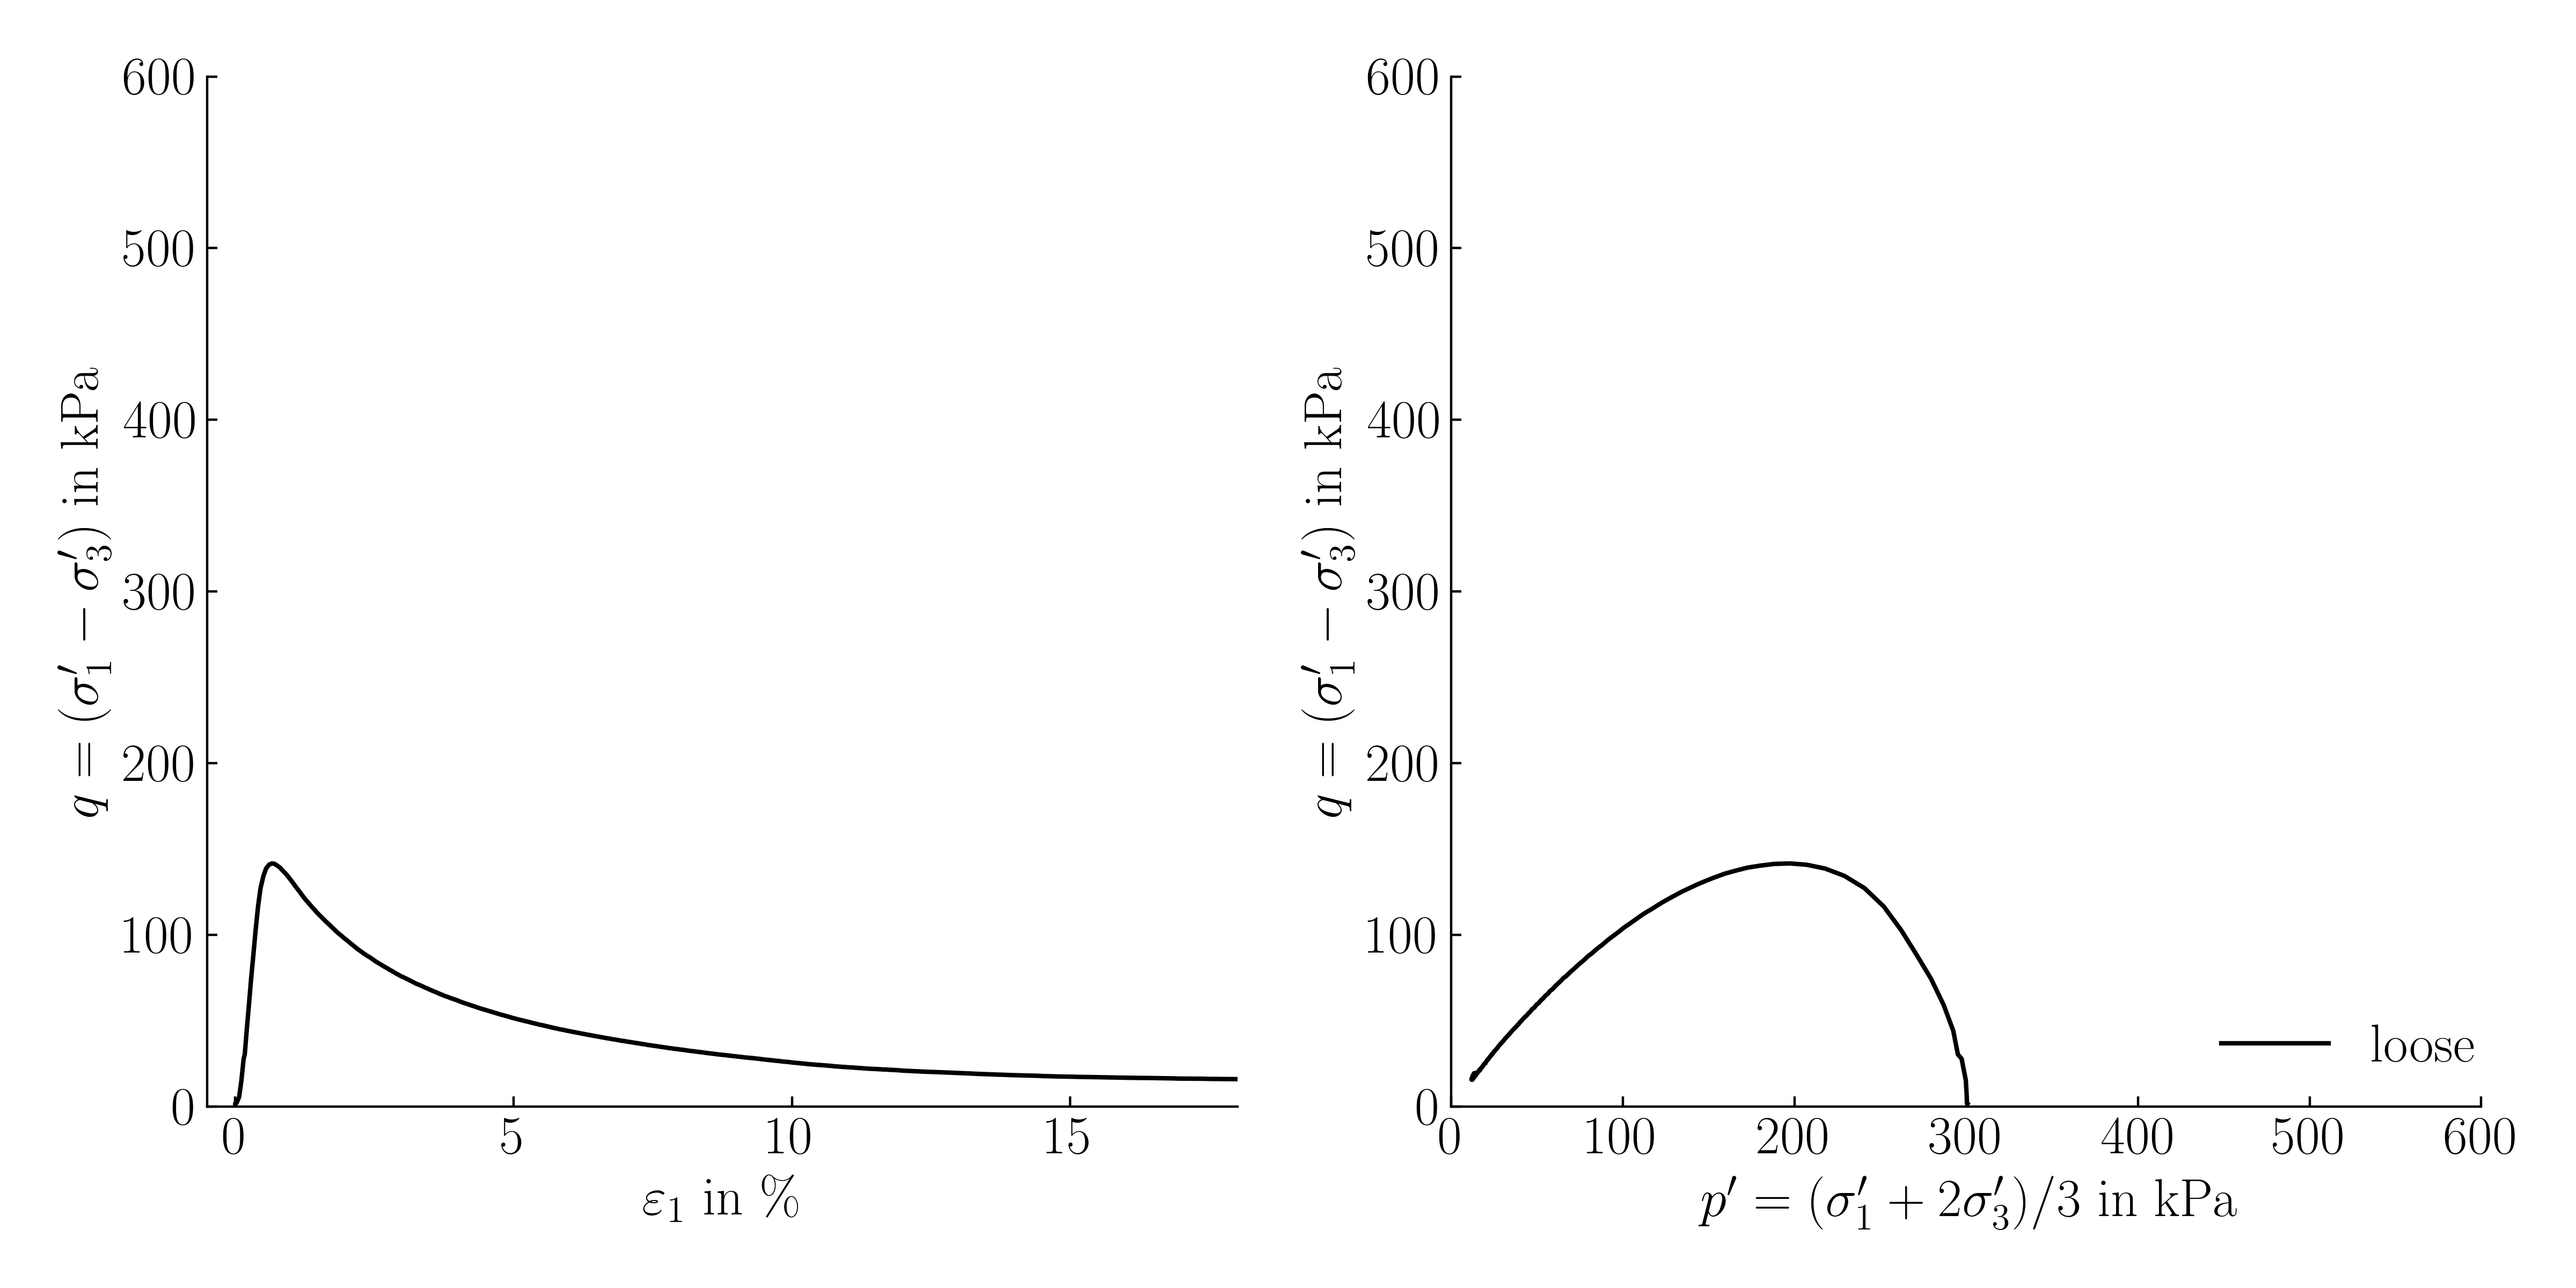 Typical behaviour of loose and dense sand under undrained shearing (click to play)
The animation starts with
-
The typical test results for a loose sample and, subsequently adds results from a medium dense and dense sample are added
-
After reaching roughly 13% axial strain in the test on the loose sample, a state emerges where both the deviatoric stress \(q\) (evident in the \(\varepsilon_1-q\) plane) and the mean effective pressure \(p^\prime\) (as seen in the \(p^\prime-q\) plane) remain relatively stable, even as the sample continues to be sheared. This unchanging stress condition, despite ongoing shear, is referred to as the "steady state".
-
By closely examining the stress paths of the tests on medium dense and dense samples, we can observe a notable change in direction. Initially, the stress path moves to the left, then later shifts to the right. This leftward movement correlates with a decrease in mean effective pressure \(p^\prime\), indicating contractancy. Conversely, the rightward progression signifies an increase in \(p^\prime\), associated with dilatancy. We thus observe a transition from contractive to dilative soil behaviour. The distinct point where this shift becomes apparent is termed the "phase transformation" (PT).
-
Upon closely examining the behaviour of the medium dense sample, distinct differences emerge in comparison with the dense sample. The dense sample shows a consistent increase in the deviatoric stress \(q\). On the other hand, the medium dense sample first attains a "local maximum" in \(q\), followed by a decrease in \(q\) until its stress path converges on the PT line. Observations from the \(\varepsilon_1-q\) plane reveal that this segment of the stress path corresponds to comparable small deformations \(\varepsilon_1 < 3-4\) %. Once the stress path aligns with the PT, both \(p^\prime\) and \(q\) start to increase (the stress path moves to the right). However, it's important to note that this increase in \(q\) is tied to substantial deformations, as is evident from the \(\varepsilon_1-q\) plane. Since this increase in \(p^\prime\) and \(q\) follows an decrease in \(q\), the PT point is often referred to as the "quasi steady state" (QSS). In practical terms, the QSS strength takes precedence. The QSS strength is most important for practical application, as the associated large deformations are typically considered undesirable/intolerable.
-
After extended shearing, the stress paths from all experiments converge on a single line in the \(p^\prime-q\) plane, known as the failure line (FL).
Comparison to drained triaxial compression tests
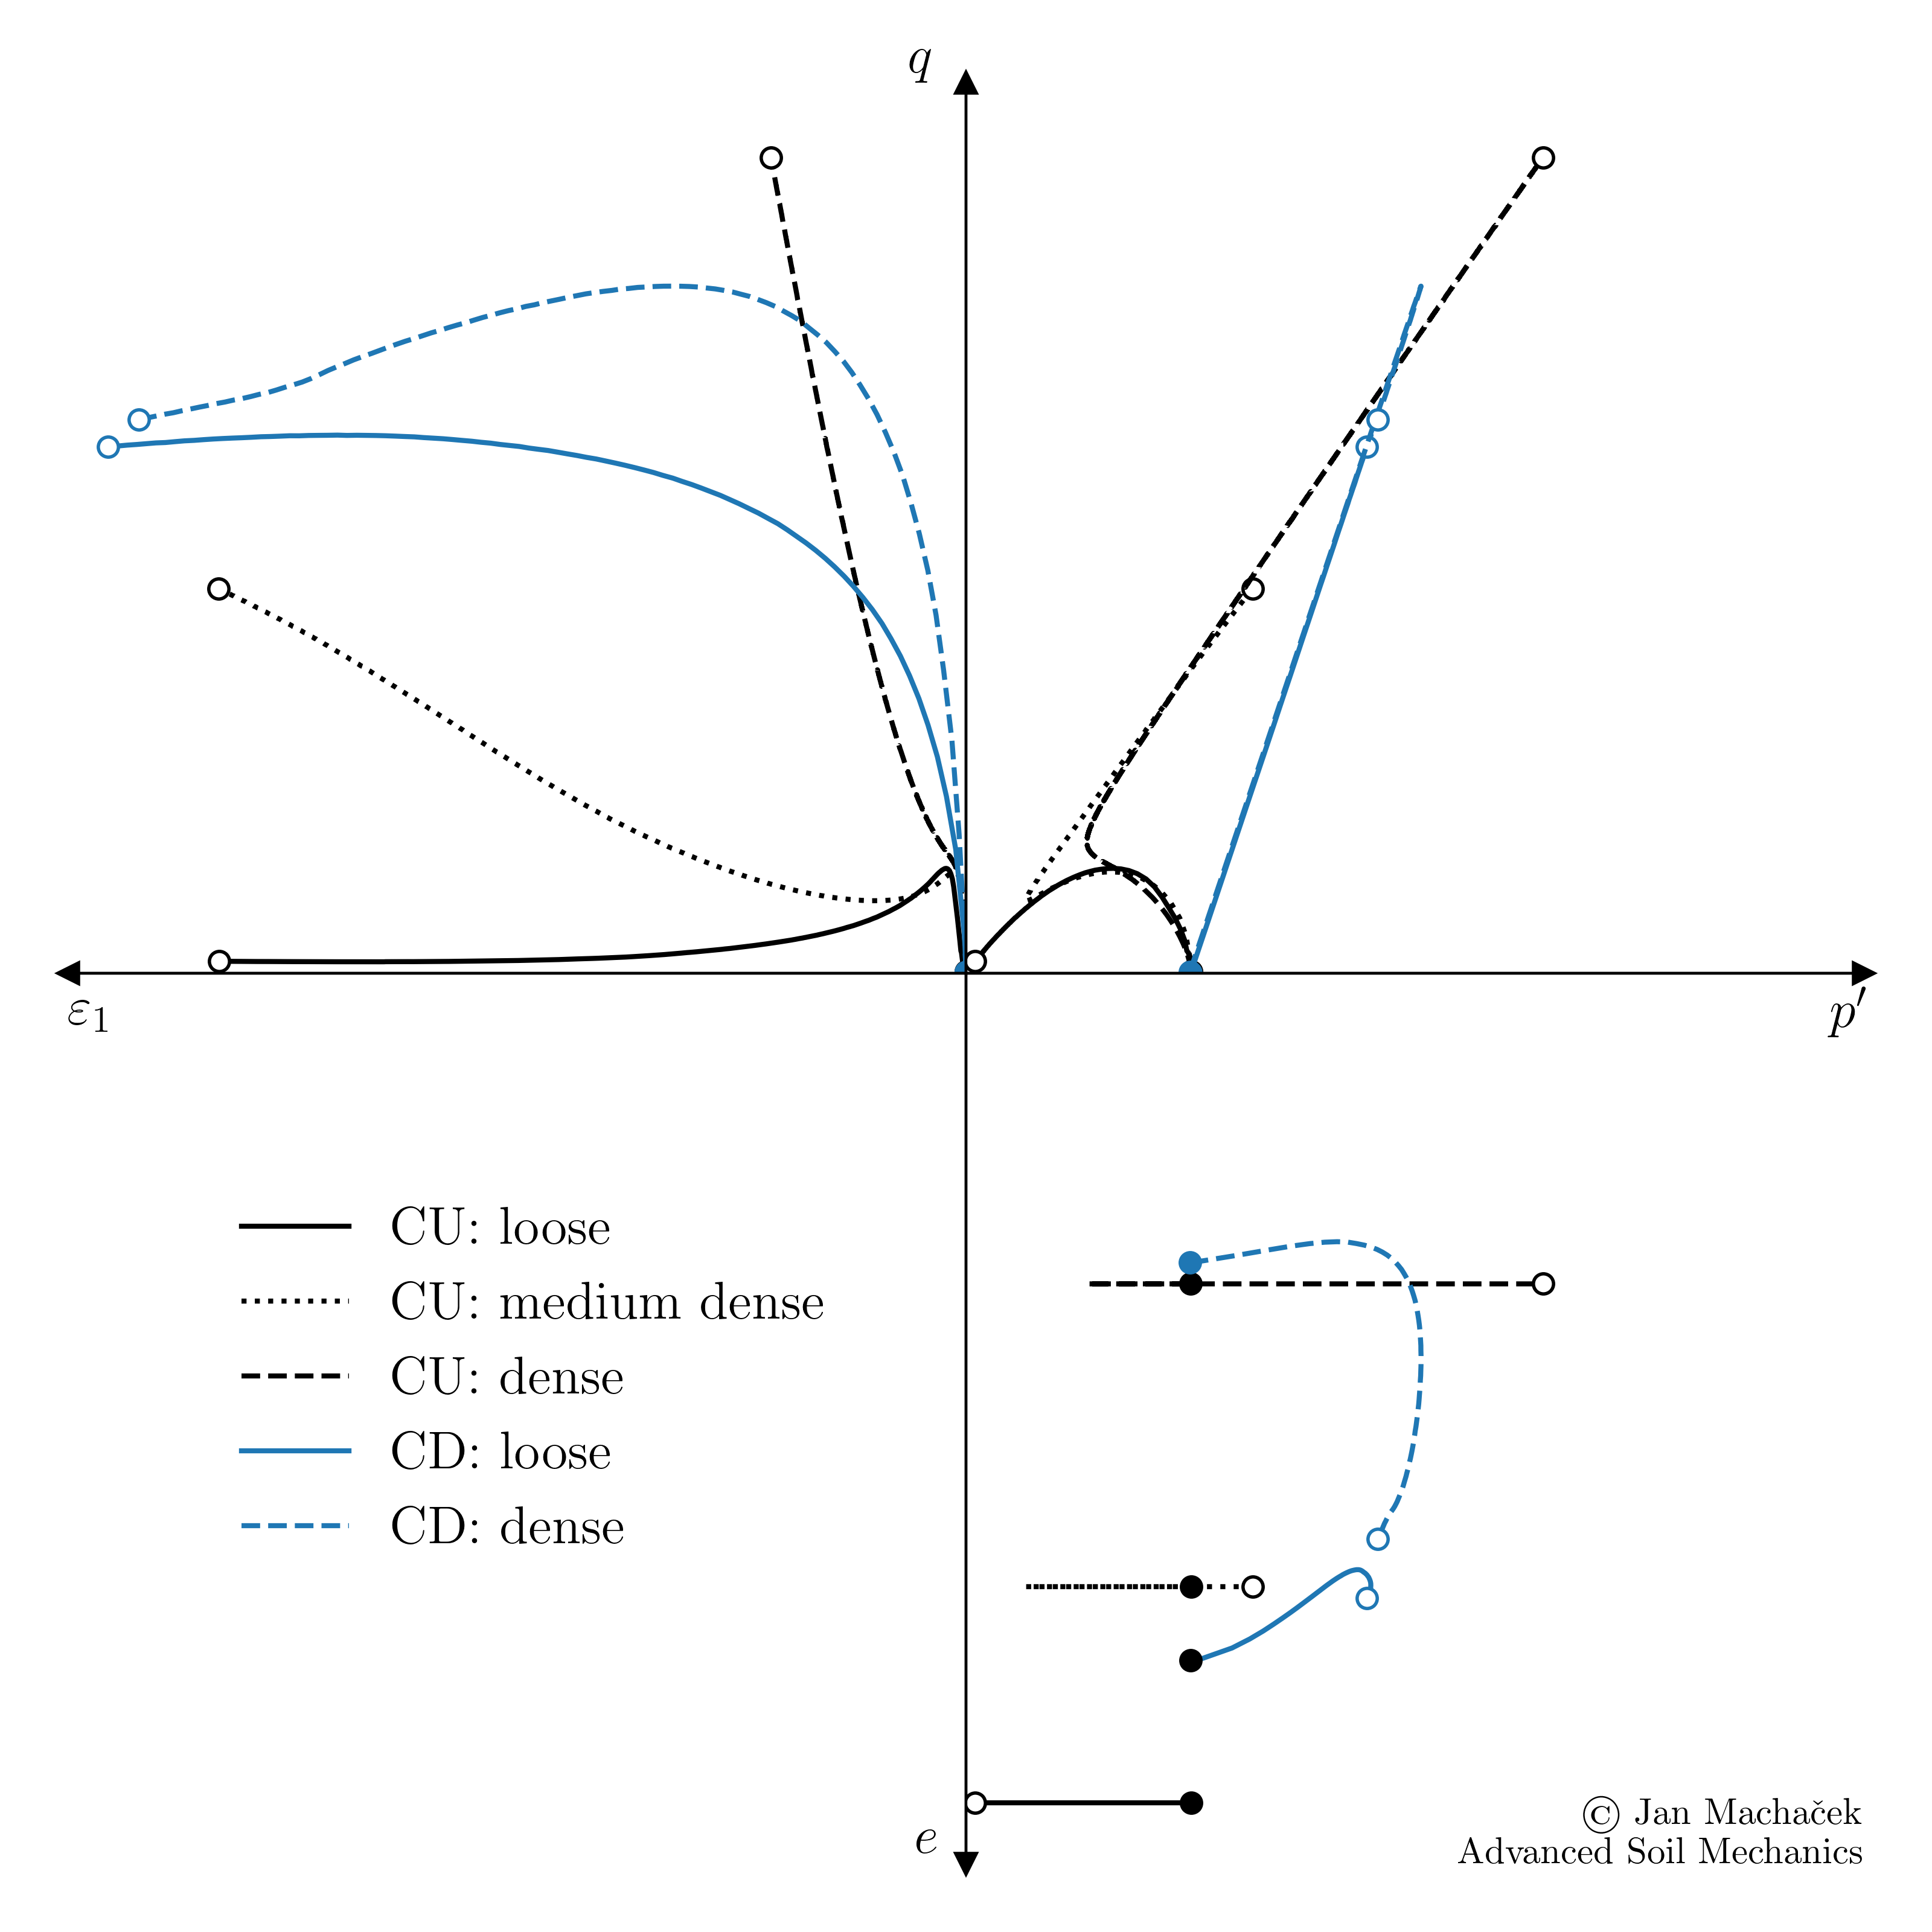
To better understand the impact of drainage conditions on soil behavior in triaxial tests, we compare the results of three undrained triaxial tests (represented by black curves) with those of two drained triaxial tests (shown in blue curves) on the same type of sand. Key observations are accentuated in the accompanying animation and discussed further below.
 Influence of the drainage condition on the stress-strain behaviour of sand samples (click to play)
- Despite the distinct stress paths of drained versus undrained tests, all paths converge to a common line at large strains, known as the failure line, which aligns quite well with the Mohr-Coulomb criterion characterized by the slope \(M_c = \dfrac{6 \sin(\varphi_c)}{3-\sin(\varphi_c)}\). This line represents the critical state where soil deformation continues without further strength gain (\(\dot{q}=0\) for \(\dot{\varepsilon}>0\)). While this state is evident in drained tests and in the undrained test of the very loose sample, the medium dense and dense samples under undrained conditions continue to show increases in deviatoric stress \(q\) and mean effective pressure \(p^\prime\) upon continued shearing, maintaining a ratio \(q/p^\prime\) close to \(M_c\).
- Comparing the evolution of void ratio with mean effective pressure, the constant volume condition of the undrained tests becomes apparent. However, as discussed in previous sections, the stress paths indicate contractive and dilative behaviour. Loose samples tend to contract, leading to an increase of pore water pressure, while denser samples tend to dilate, reducing pore water pressure. These changes in pore water pressure, \(\Delta p^w\), can be quantified on the \(p-q\) plane by comparing the undrained and drained stress paths:
- The stress path during the drained triaxial tests, with its characteristic slope of 1:3, is equivalent to the total stress path subtracted by the back pressure observed during the undrained triaxial tests.
- Applying the effective stress concept \(\sigma_{ij}^\prime = \sigma_{ij} - p^w\), we find that the horizontal gap between the total and effective stress paths represents the change in pore water pressure, \(\Delta p^w\). The incremental formulation (\(\Delta ...\)) comes from the fact that we are looking at the evolution, thus change, of \(p\) and \(q\) starting from an initial state.
- Notably, the stress path of the undrained test on the dense sample eventually intersects with that of the drained tests. This intersection signifies a shift in excess pore water pressure: below this point, positive excess pressures are indicated by effective stress paths to the left of the total stress path. Above the crossing, negative excess pressures emerge, with effective stress paths to the right of the total stress path, indicating a reduction in pore water pressure. This leads to an increase in effective stress and, correspondingly, an increase in shear strength, with the deviatoric stress \(q\) then calculated as \(q \approx M_c p^\prime\).
References
-
T. Wichtmann and T. Triantafyllidis, ‘An experimental database for the development, calibration and verification of constitutive models for sand with focus to cyclic loading: part I—tests with monotonic loading and stress cycles’, Acta Geotech., vol. 11, no. 4, pp. 739–761, Aug. 2016, doi: 10.1007/s11440-015-0402-z. ↩