User defined amplitude
The input files can be downloaded here.
In this example the use of user defined amplitudes is demonstrated. For this purpose we consider the same rigid foundation on an elastic soil layer already studied in the tutorial Rigid strip footing. The model specifications are shown in Figure 1. The foundation is loaded by a distributed load along the top surface of the foundation and the settlement is studied assuming ideally drained conditions.
 Figure 1. Model of the rigid foundation
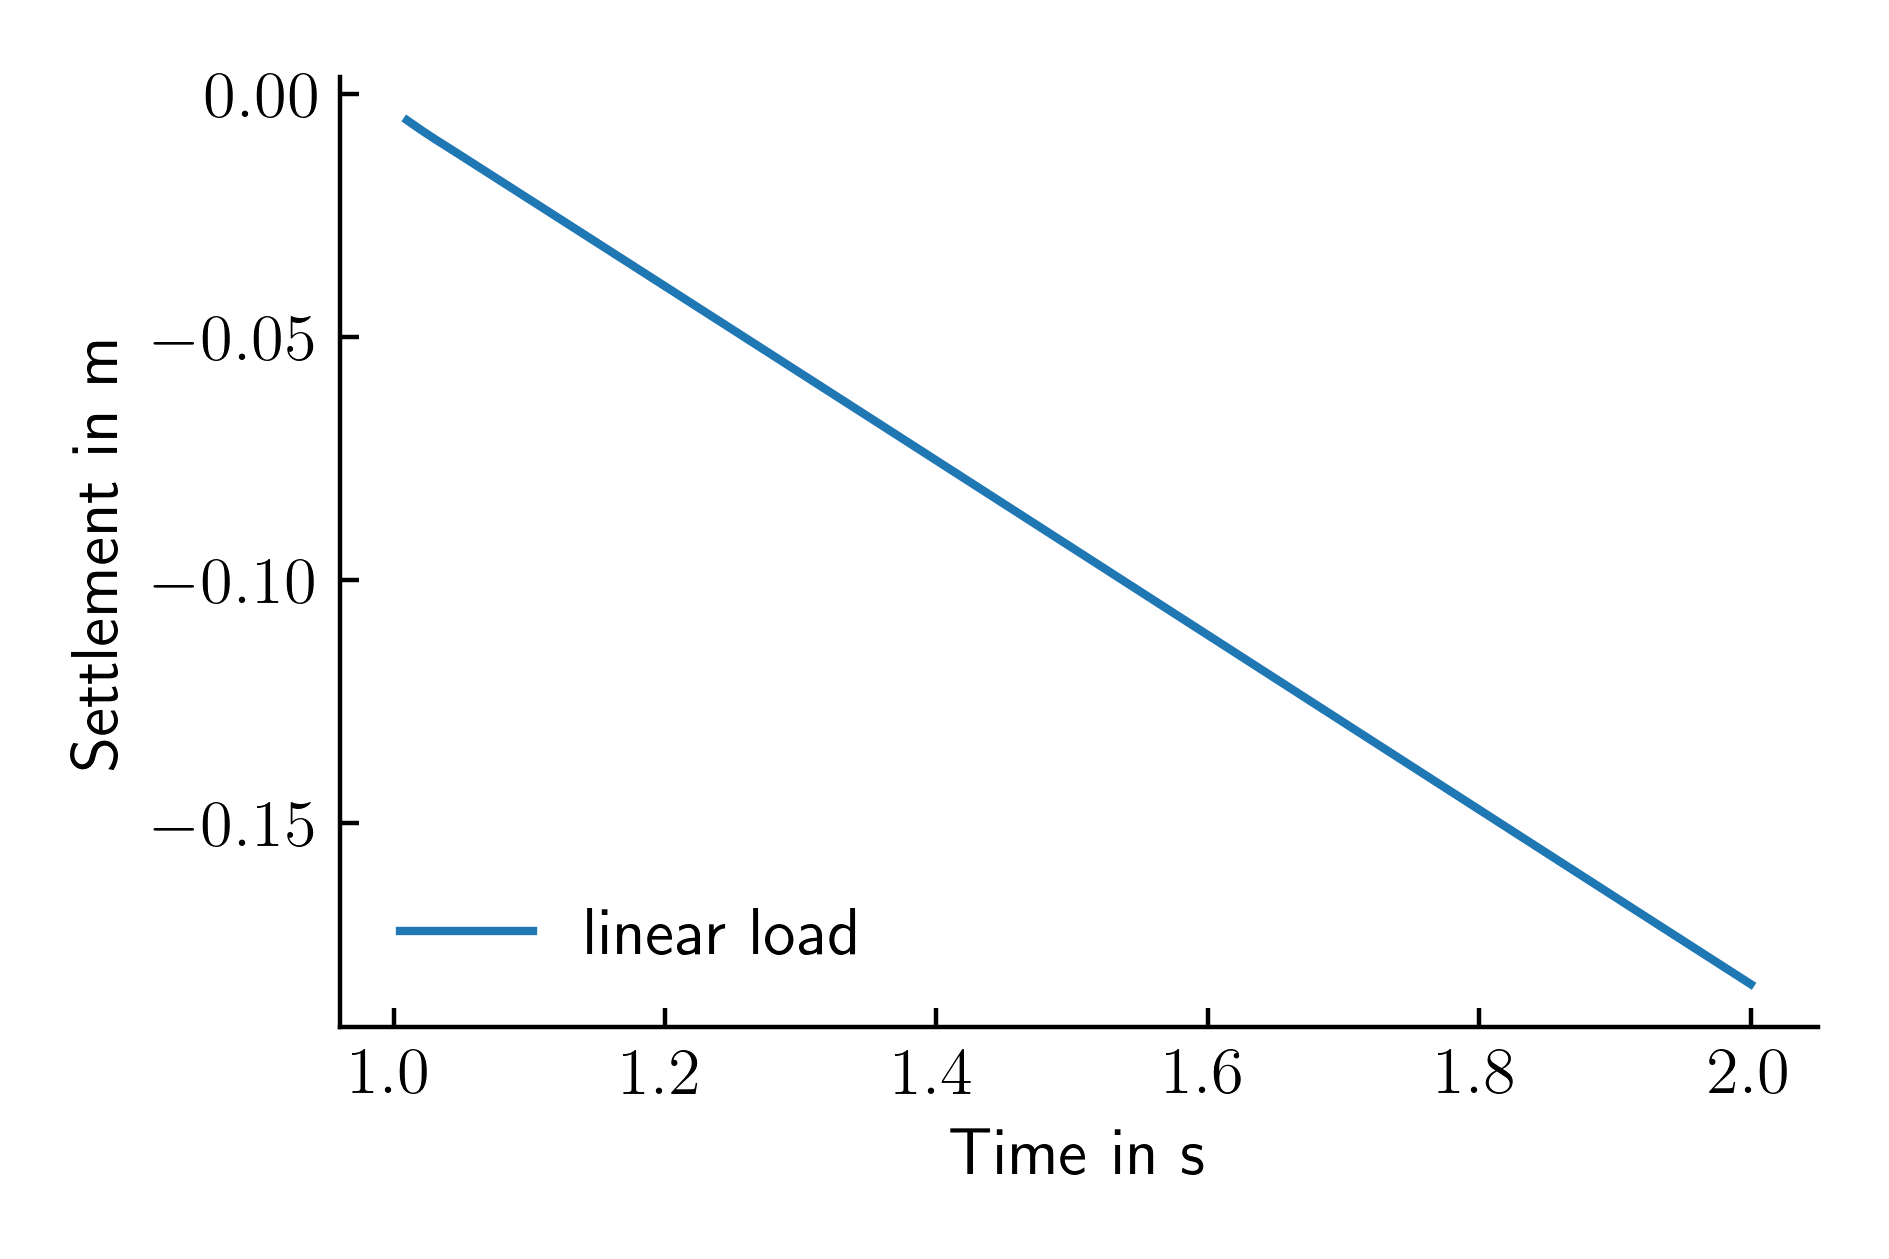
In the reference simulation the external load \(\Delta \sigma_v\) is increased linearly with time \(t\) such that \(\Delta \sigma_v(t=0 ~\text{s}) = 0\) kPa and \(\Delta \sigma_v(t=1 ~\text{s})=500\) kPa. The resulting vertical displacements of the top left node of the shallow foundation are reported in Figure 2.

Figure 2. Settlement time history of the top left node of the shallow foundation
For the sake of this tutorial we will now consider a more complicated variation of \(\Delta \sigma_v\) with time. Instead of a linearly increasing external load, we want the load to follow the following equation:
where \(t\) is the time, \(f_1\) and \(f_2\) are the frequencies of the harmonic parts of the signal. Such a case is very unusual and therefore not directly implemented in numgeo. Although it could be reconstructed from a superposition of three different loads (one linearly increasing load and two sinusoidal loads with different frequencies and magnitudes) - this is quite complex. A simpler method is to use a user defined amplitude. For this we introduce first a slight modification to the input file of the reference simulation by specifying a new amplitude in the input file - using the user keyword:
*Amplitude, name = user_amplitude, type = user
Notice that the name user_amplitude is chosen arbitrarily and can be changed at will. Next, we copy the files user_amplitude.f90 and user_amplitude.bat to the directory where we want to run the simulation. Once the files are relocated, we implement above equation into the Fortran file:
subroutine user_amplitude(time,nprops,props,value)
    implicit none
    !DEC$ ATTRIBUTES DLLEXPORT, STDCALL, REFERENCE :: user_amplitude
    real(8)                   , intent(in)    :: time     !! current step time
    integer                   , intent(in)    :: nprops   !! number of user specified properties
    real(8), dimension(nprops), intent(in)    :: props    !! properties of this amplitude
    real(8), dimension(3)     , intent(inout) :: value    !! value of this amplitude

    real(8), parameter :: pi = 3.147d0
    real(8), parameter :: omega = 2.0d0 * pi * 2.0d0
    real(8), parameter :: omega2 = 2.0d0 * pi * 10.0d0
    value = 0.0d0
    value(1) = time+(sin(omega*time)/5-sin(omega2*time)/20.)

end subroutine user_amplitude
subroutine user_amplitude(time,nprops,props,value) &
    bind(c,name='user_amplitude')
    use, intrinsic :: iso_c_binding
    implicit none
    real(c_double)                   , intent(in)    :: time    !! current step time
    integer(c_int)                   , intent(in)    :: nprops  !! number of user properties
    real(c_double), dimension(nprops), intent(in)    :: props   !! properties
    real(c_double), dimension(3)     , intent(inout) :: value   !! value of this amplitude

    real(8), parameter :: pi = 3.147d0
    real(8), parameter :: omega = 2.0d0 * pi * 2.0d0
    real(8), parameter :: omega2 = 2.0d0 * pi * 10.0d0
    value = 0.0d0
    value(1) = time+(sin(omega*time)/5-sin(omega2*time)/20.)

end subroutine user_amplitude
In above implementation, we used the relation \(\omega = 2 \pi f\). Note that only the part inside the rectangular brackets of above equation is implemented in the user routine. The constant load magnitude of 500 kPa is considered in the input file:
*DSload, amplitude = user_amplitude
surf_foundation_top, p, -500.0d0
As can be seen from above code snipped, the last modification to the reference input file is the change in the name of the amplitude used for the load application amplitude = user_amplitude.
The shell script guiding the compilation of the user defined amplitude is as follows:
ifort -O3 /dll user_amplitude.f90
#!/bin/bash
ifort -c -shared -fPIC user_amplitude.f90
ifort -shared -fPIC user_amplitude.o -o user_amplitude.so
The simulation can now be started from the terminal using the standard procedure, e.g.
numgeo inp=input out=simulation ncpus=4
./numgeo inp=input out=simulation ncpus=4
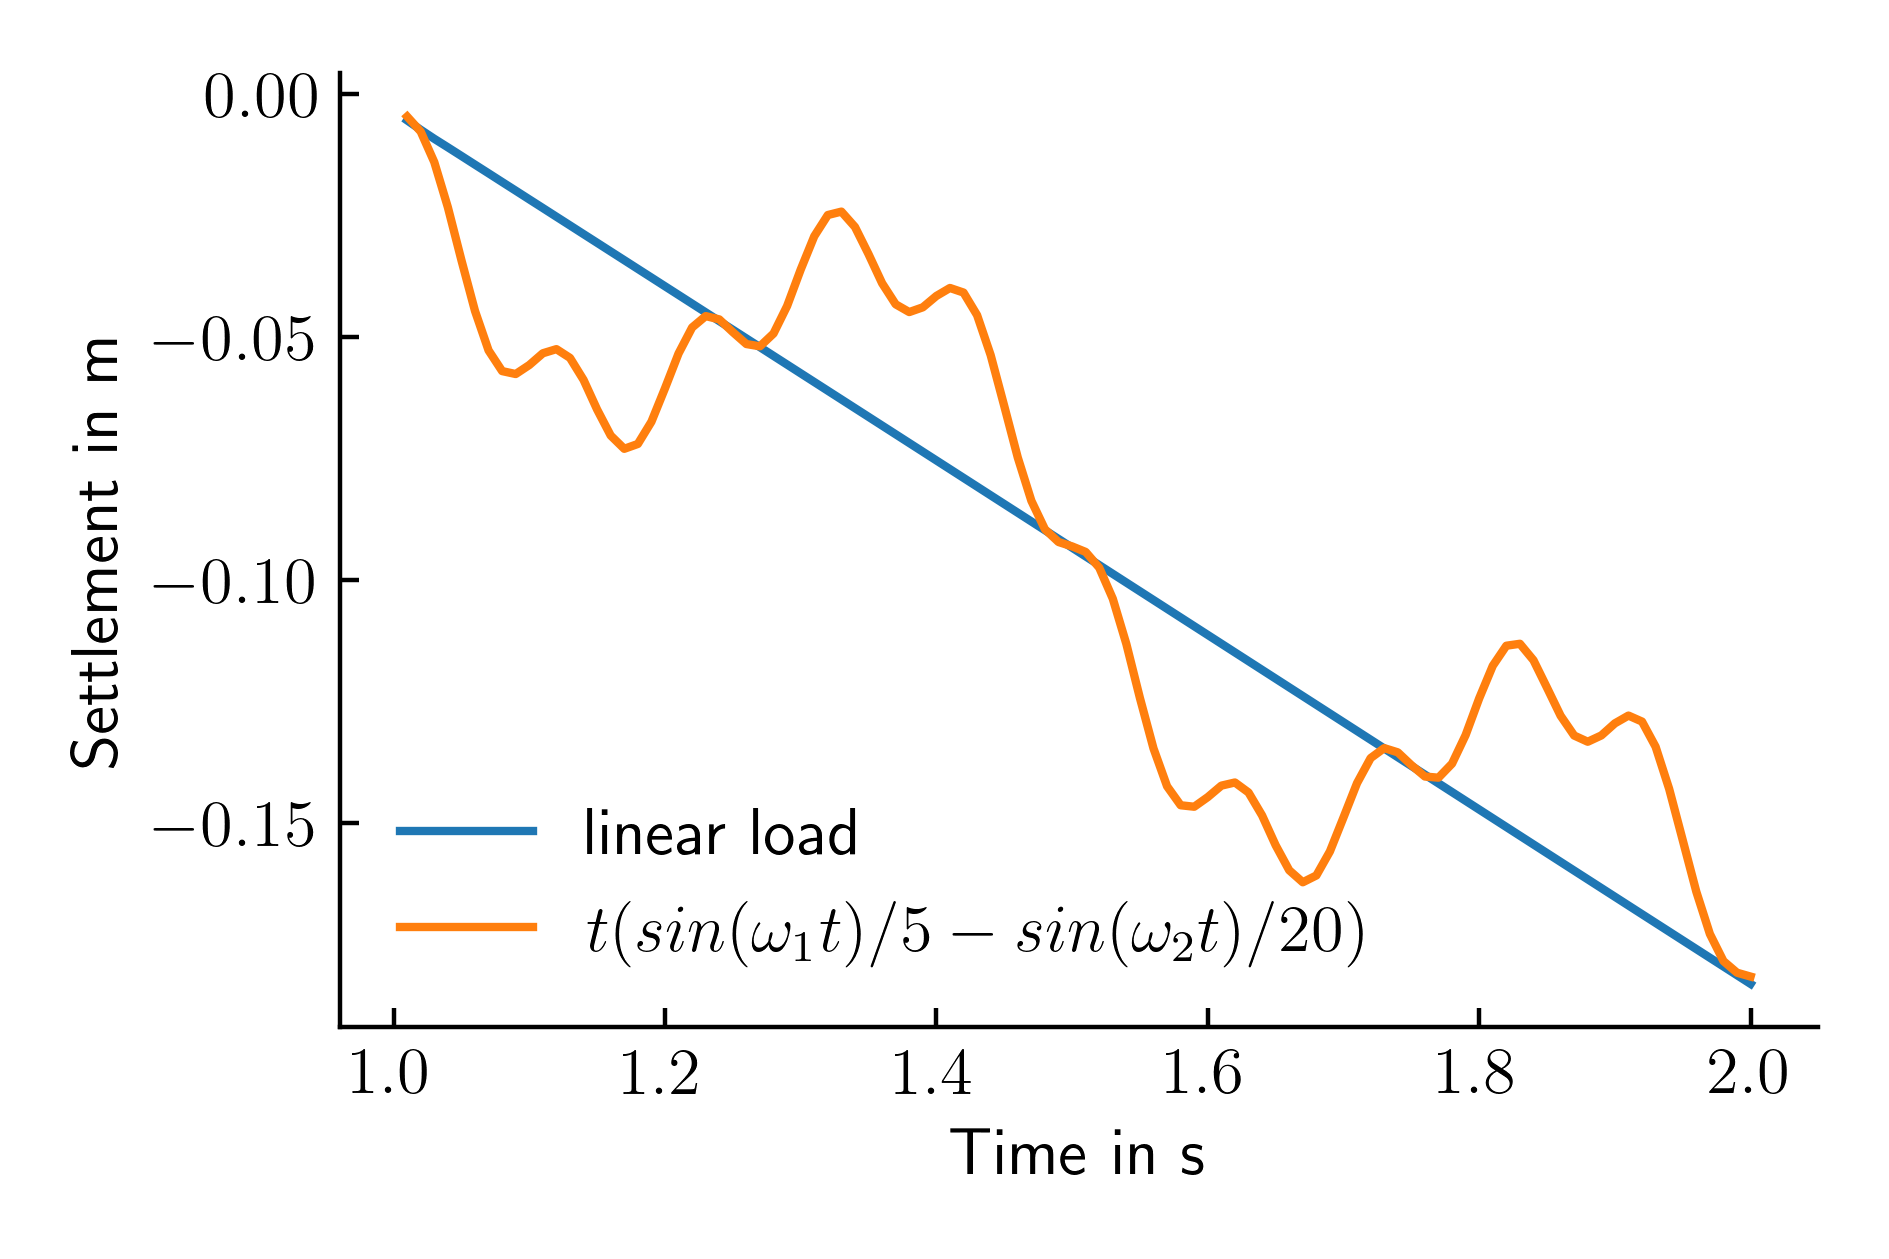
numgeo will automatically compile the user subroutine user_amplitude.f90 and link it to the code. The resulting settlement-time history is given in Figure 3 and compared to the reference simulation using a linear increasing amplitude.

Figure 3. Settlement time history of the top left node of the shallow foundation for a linear increasing load and a load following a user defined amplitude
Plotting the results
For plotting the results as shown in above figures, the following python script can be used:
#%%
import numpy as np
import matplotlib.pyplot as plt

plt.rcParams['xtick.direction'] = 'in'
plt.rcParams['ytick.direction'] = 'in'
plt.rcParams['text.usetex'] = True
plt.rcParams['font.size'] = 12
plt.rcParams['axes.spines.right'] = False
plt.rcParams['axes.spines.top'] = False

def cm2inch(*tupl):
    inch = 2.54
    if isinstance(tupl[0], tuple):
        return tuple(i/inch for i in tupl[0])
    else:
        return tuple(i/inch for i in tupl)

node_set_name = "FOUNDATION.TOP_LEFT_NODE_node_7703.dat"

ref = np.genfromtxt("./reference/simulation-print-out/"+node_set_name, skip_header=1)
data = np.genfromtxt("./user-amplitude-mesh-new/simulation-print-out/"+node_set_name, skip_header=1)

plt.figure(figsize=cm2inch(12,8))
plt.plot(ref[:,0], ref[:,2], label='linear load')
plt.plot(data[:,0], data[:,2], label='$t (sin(\omega_1 t)/5 - sin(\omega_2 t)/20)$')
plt.xlabel('Time in s')
plt.ylabel('Settlement in m')
plt.legend(loc='lower left', frameon=False)
plt.tight_layout()
plt.savefig('./time_settlement_user_amplitude.pdf', dpi=400)
plt.savefig('./time_settlement_user_amplitude.png', dpi=400)