Visualization of results
Field output
Currently, only output written in vtk format is supported, which allows visualization using the program ParaView (Download here). To see the output of the calculation, start ParaView and open the pvd
file (in the right upper options bar: "File" \(\rightarrow\)
"Open...").
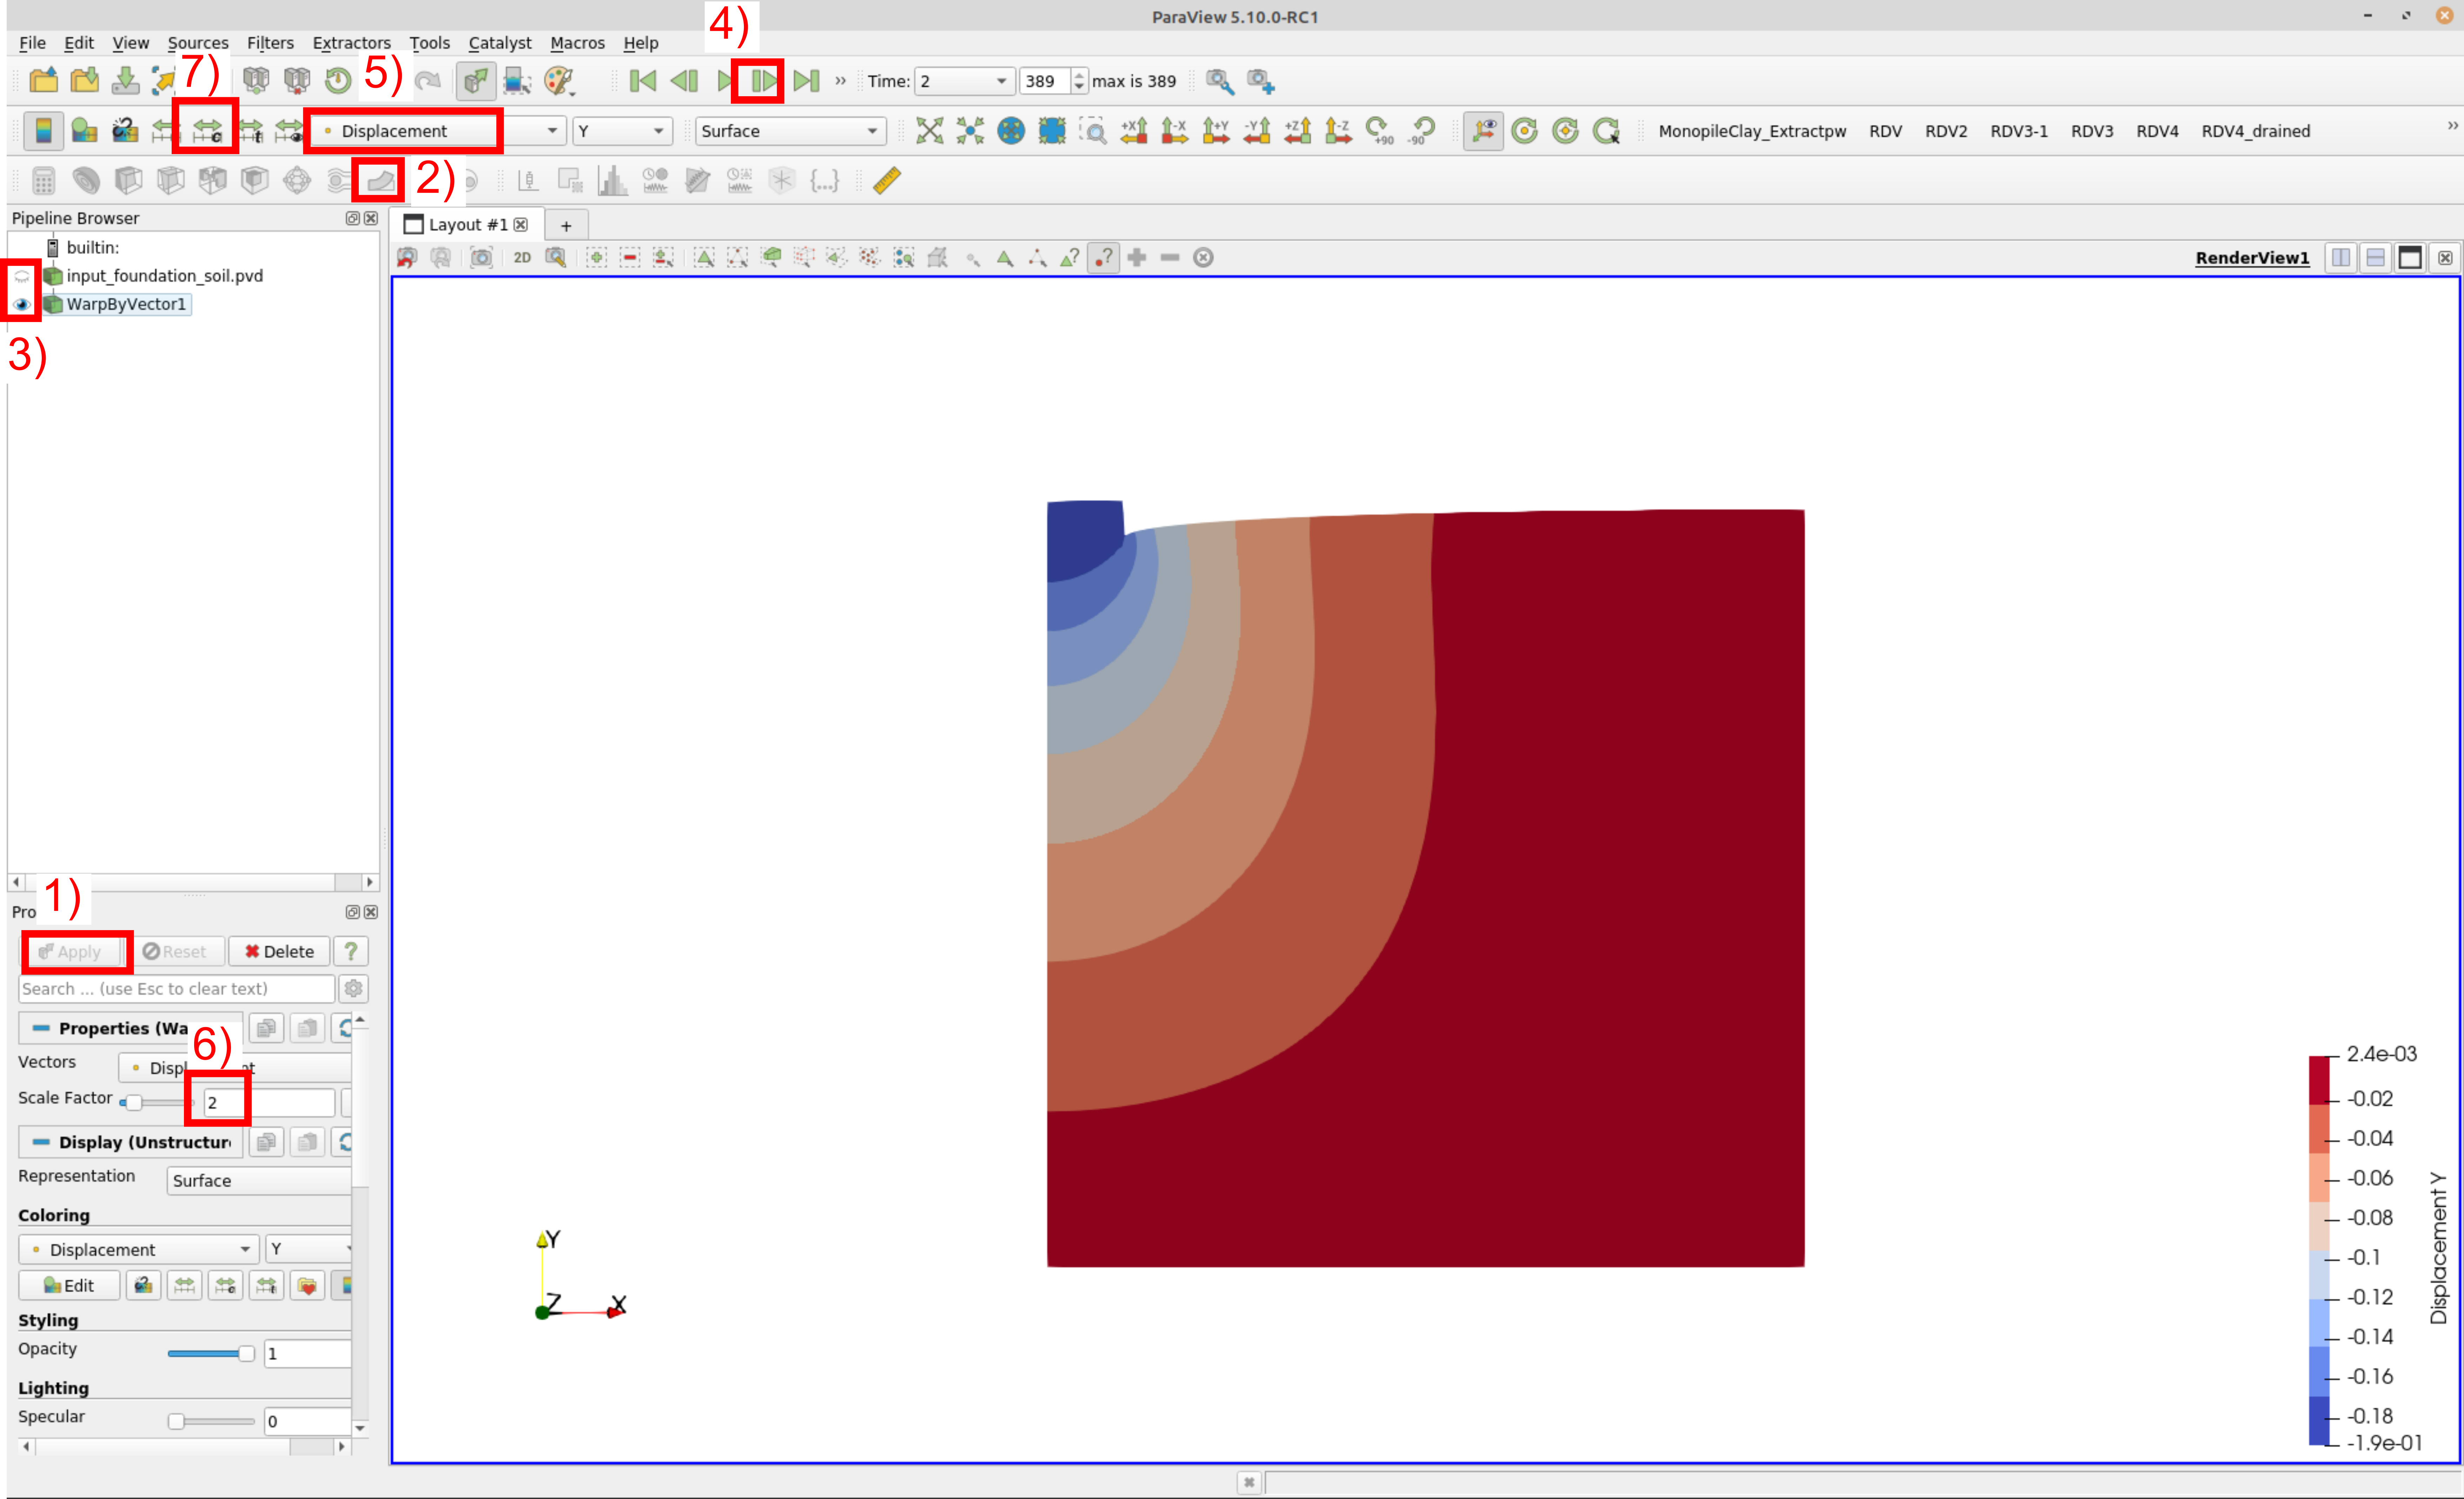 Figure 1. Steps for visualizing the deformed configuration of a simulation
After having opened the pvd file, follow the steps shown in Figure 1 to display the deformed system. Note that in (step 6) a deformation scale factor of 2 is chosen. This means that the deformed state is depicted with 2 times greater displacement.
Print output
The print output is used to save more detailed output information for selected nodes, elements or integration points for each increment. A folder with the subfix -print-out is created into which the files for each of the requested data points are written. The files can be post-processed using any programme such as Python or Excel. Examples can be found in the tutorials.