Homogeneous slope (Pruška 2009)
The first benchmark example studied was first presented by Pruška (2009)1 who compared the performance of the geotechnical finite element software products Plaxis, ZSoil and GEO4 (now GEO5). The same example was later used by rocscience to verify the strength-reduction implementation of RS2.
This benchmark features a homogeneous slope with a height of 7 m and a width of 10 m as shown in Figure 1.
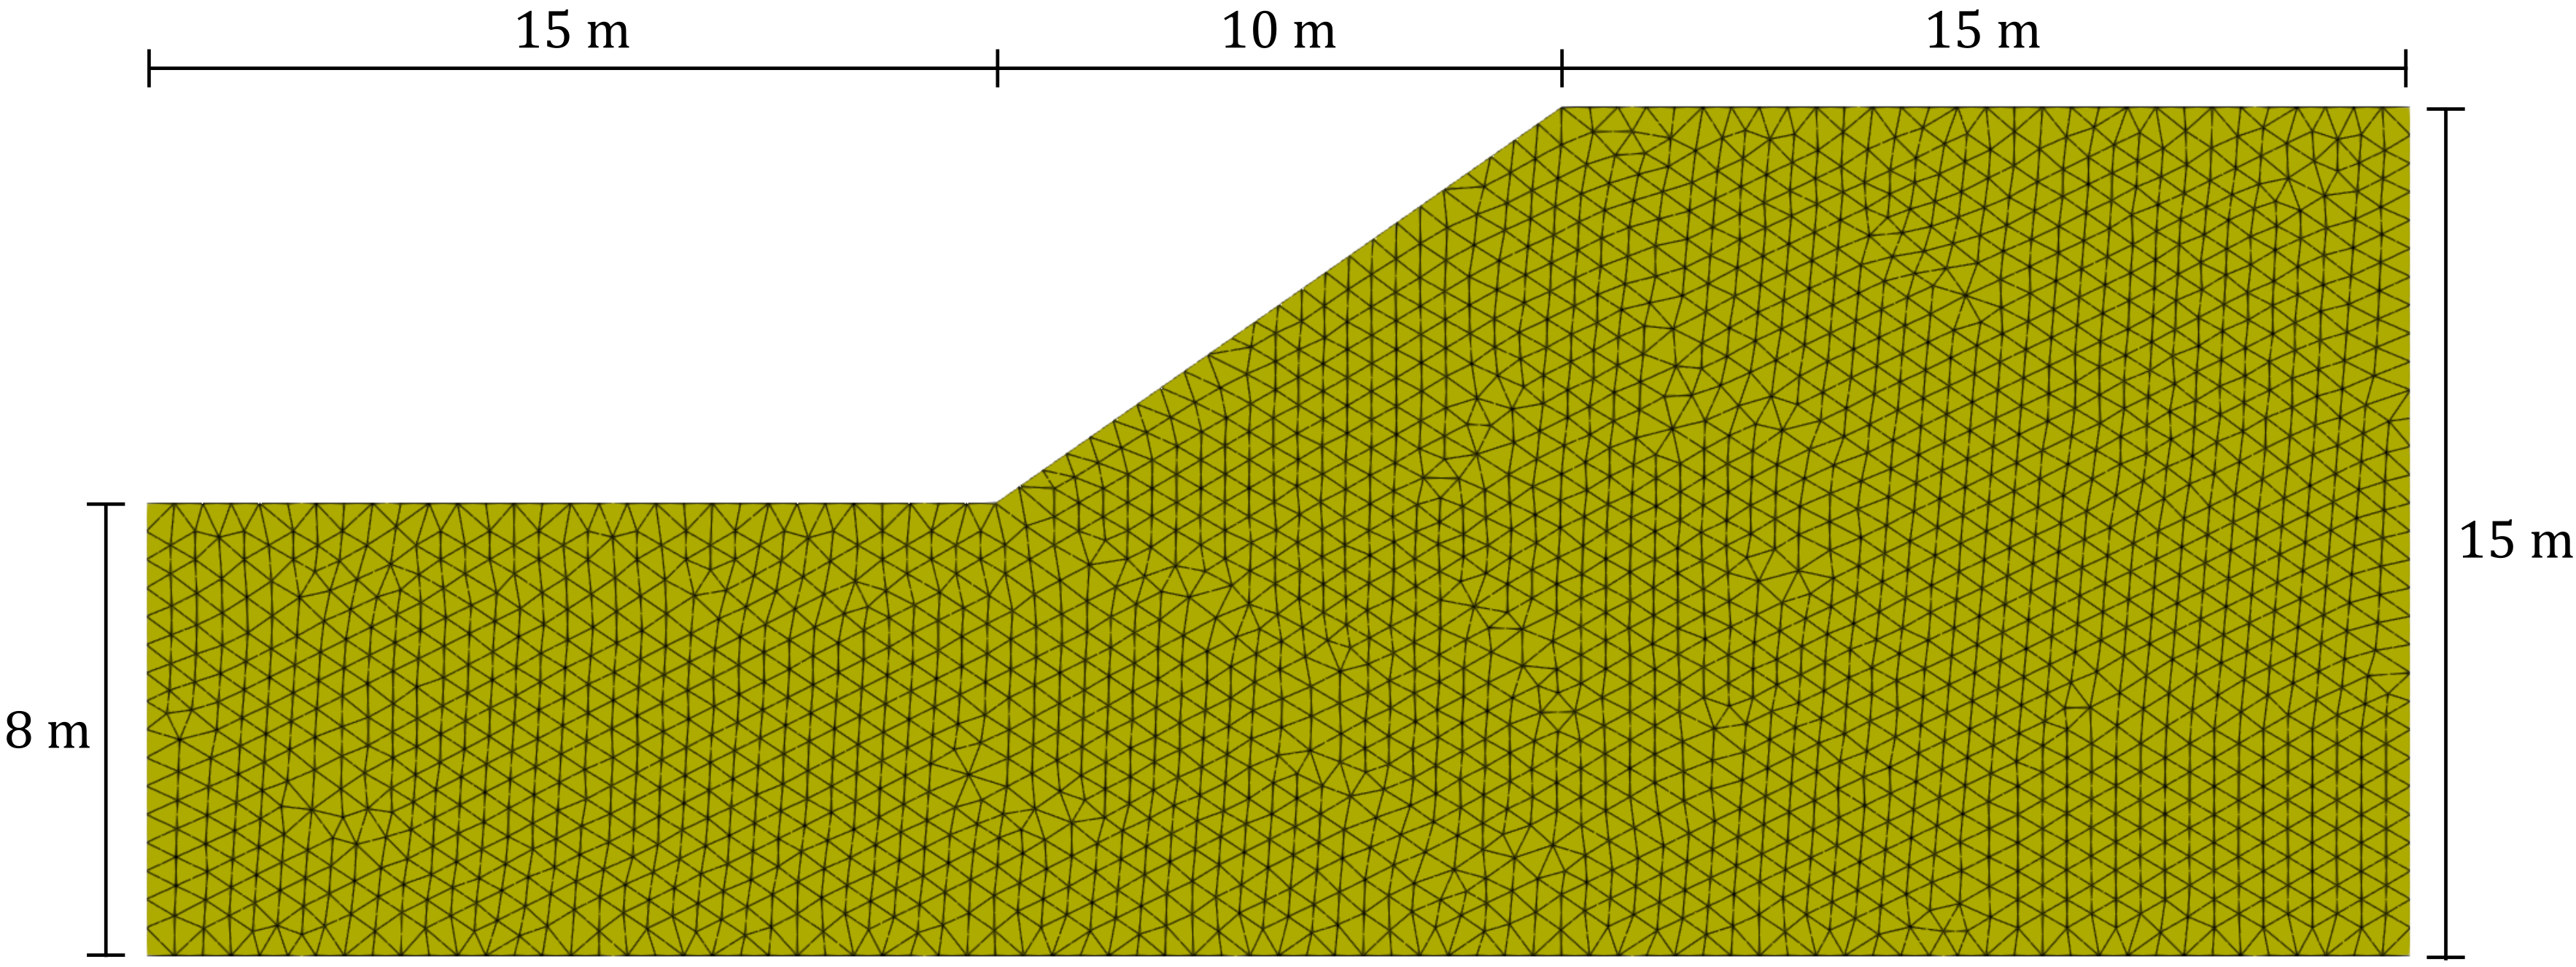
Figure 1. Problem setting and representative finite element mesh of the homogeneous slope.
Four cases with different soil properties were studied. The linear elastic, perfectly plastic Mohr-Coulomb (M-C) model was used in the analysis. The material properties of all four cases are as follows:
| case | \(E\) (kPa) | \(\nu\) | c (kPa) | \(\varphi\) (°) | \(\rho\) (t/m³) |
|---|---|---|---|---|---|
| 1 | 5000 | 0.3 | 20 | 10 | 2.4 |
| 2 | 5000 | 0.3 | 20 | 20 | 2.4 |
| 3 | 5000 | 0.35 | 5 | 20 | 1.8 |
| 4 | 5000 | 0.3 | 20 | 30 | 2.4 |
where \(E\) denotes the Young's modulus, \(\nu\) the Poisson's ratio, \(c\) the effective cohesion and \(\varphi\) the effective friction angle, respectively. \(\rho\) is the density of the soil. The dilatation angle was assumed as \(\psi=0\)° in all cases. No tension cut-off was used. Both, the Mohr-Coulomb-2 and Mohr-Coulomb-3 models were used for the simulations in numgeo.
Input files
The input files for the benchmark simulation can be downloaded here and the corresponding GiD (GUI) files from here. Details on how to create the finite element model and properly define the analysis is given in the corresponding tutorial
The displacement contour plot and deformed geometry for case 1 are depicted in Figure 2. The simulation results show a clear failure mechanism resembling a circular slip surface.
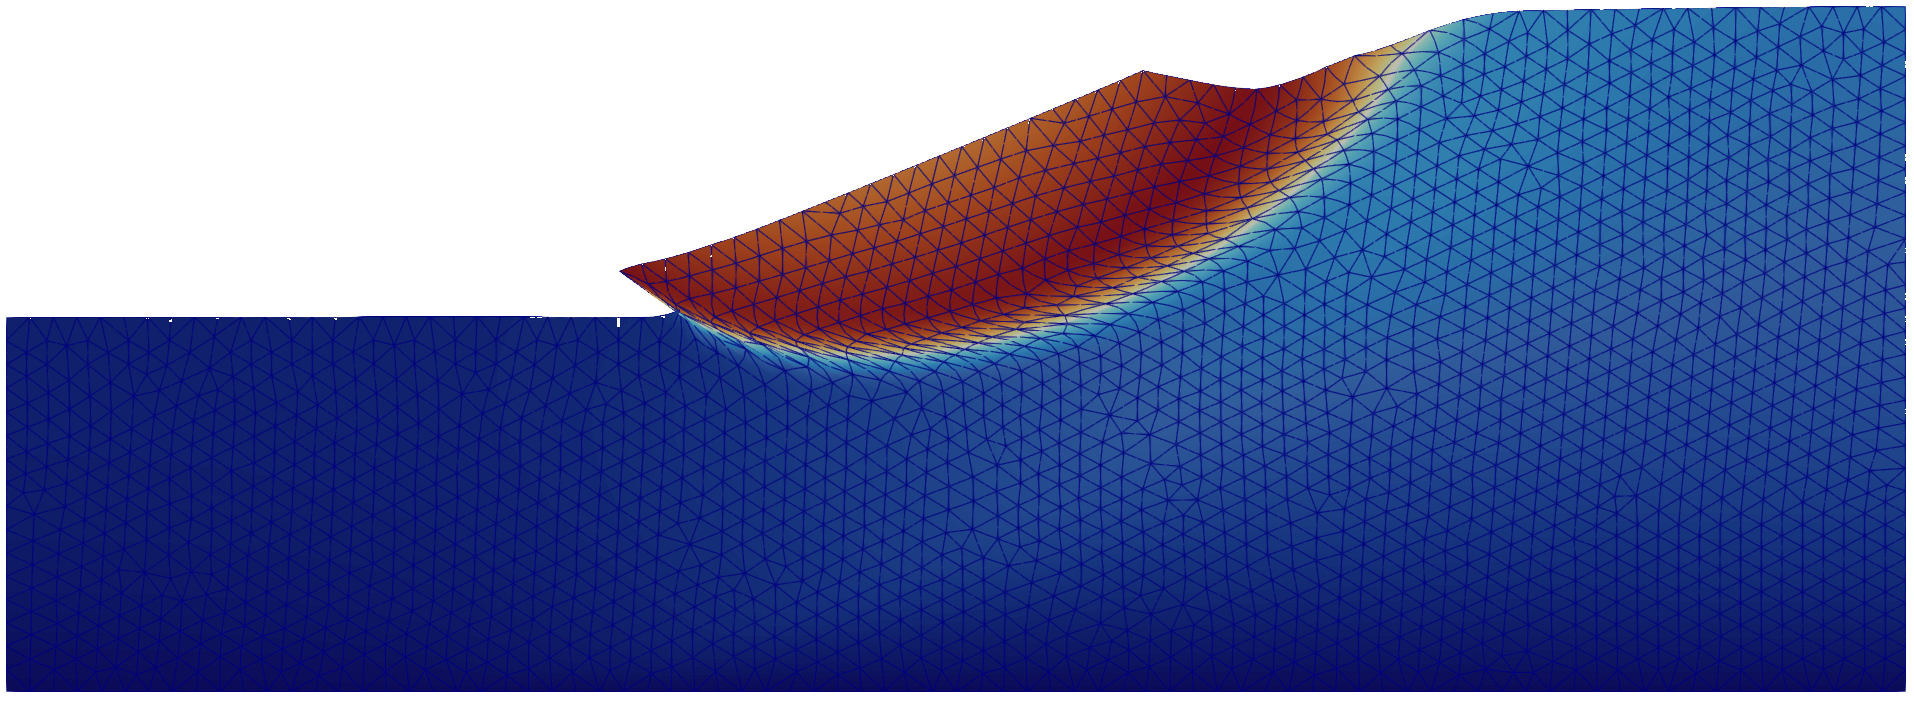
Figure 2. Displacement contour plot and deformed geometry for case 1 calculated with numgeo and the Mohr-Coulomb-3 model.
The resulting Factor of Safety (FoS) obtained with numgeo is compared to the results of the four different software packages in Table 2. A very good agreement between the numgeo results and the programs Plaxis, ZSoil and RS2 is attested.
Table 2. Calculated FoS for case 1 Mohr-Coulomb-3 for different finite element codes.
| numgeo | Plaxis | ZSoil | GEO4 | RS2 | |
|---|---|---|---|---|---|
| FoS | 1.22 | 1.22 | 1.21 | 1.31 | 1.22 |
Note that the estimation of the slope stability based on non-convergence might yield slight overestimation of the FoS. For this reason, it is emphasized to also inspect the max. displacements vs. FoS plot. In this plot (Fig. 3), the critical FoS indicating the level of safety of the slope under investigation can be identified by a sharp kink in the FoS vs. max. displacements plot.
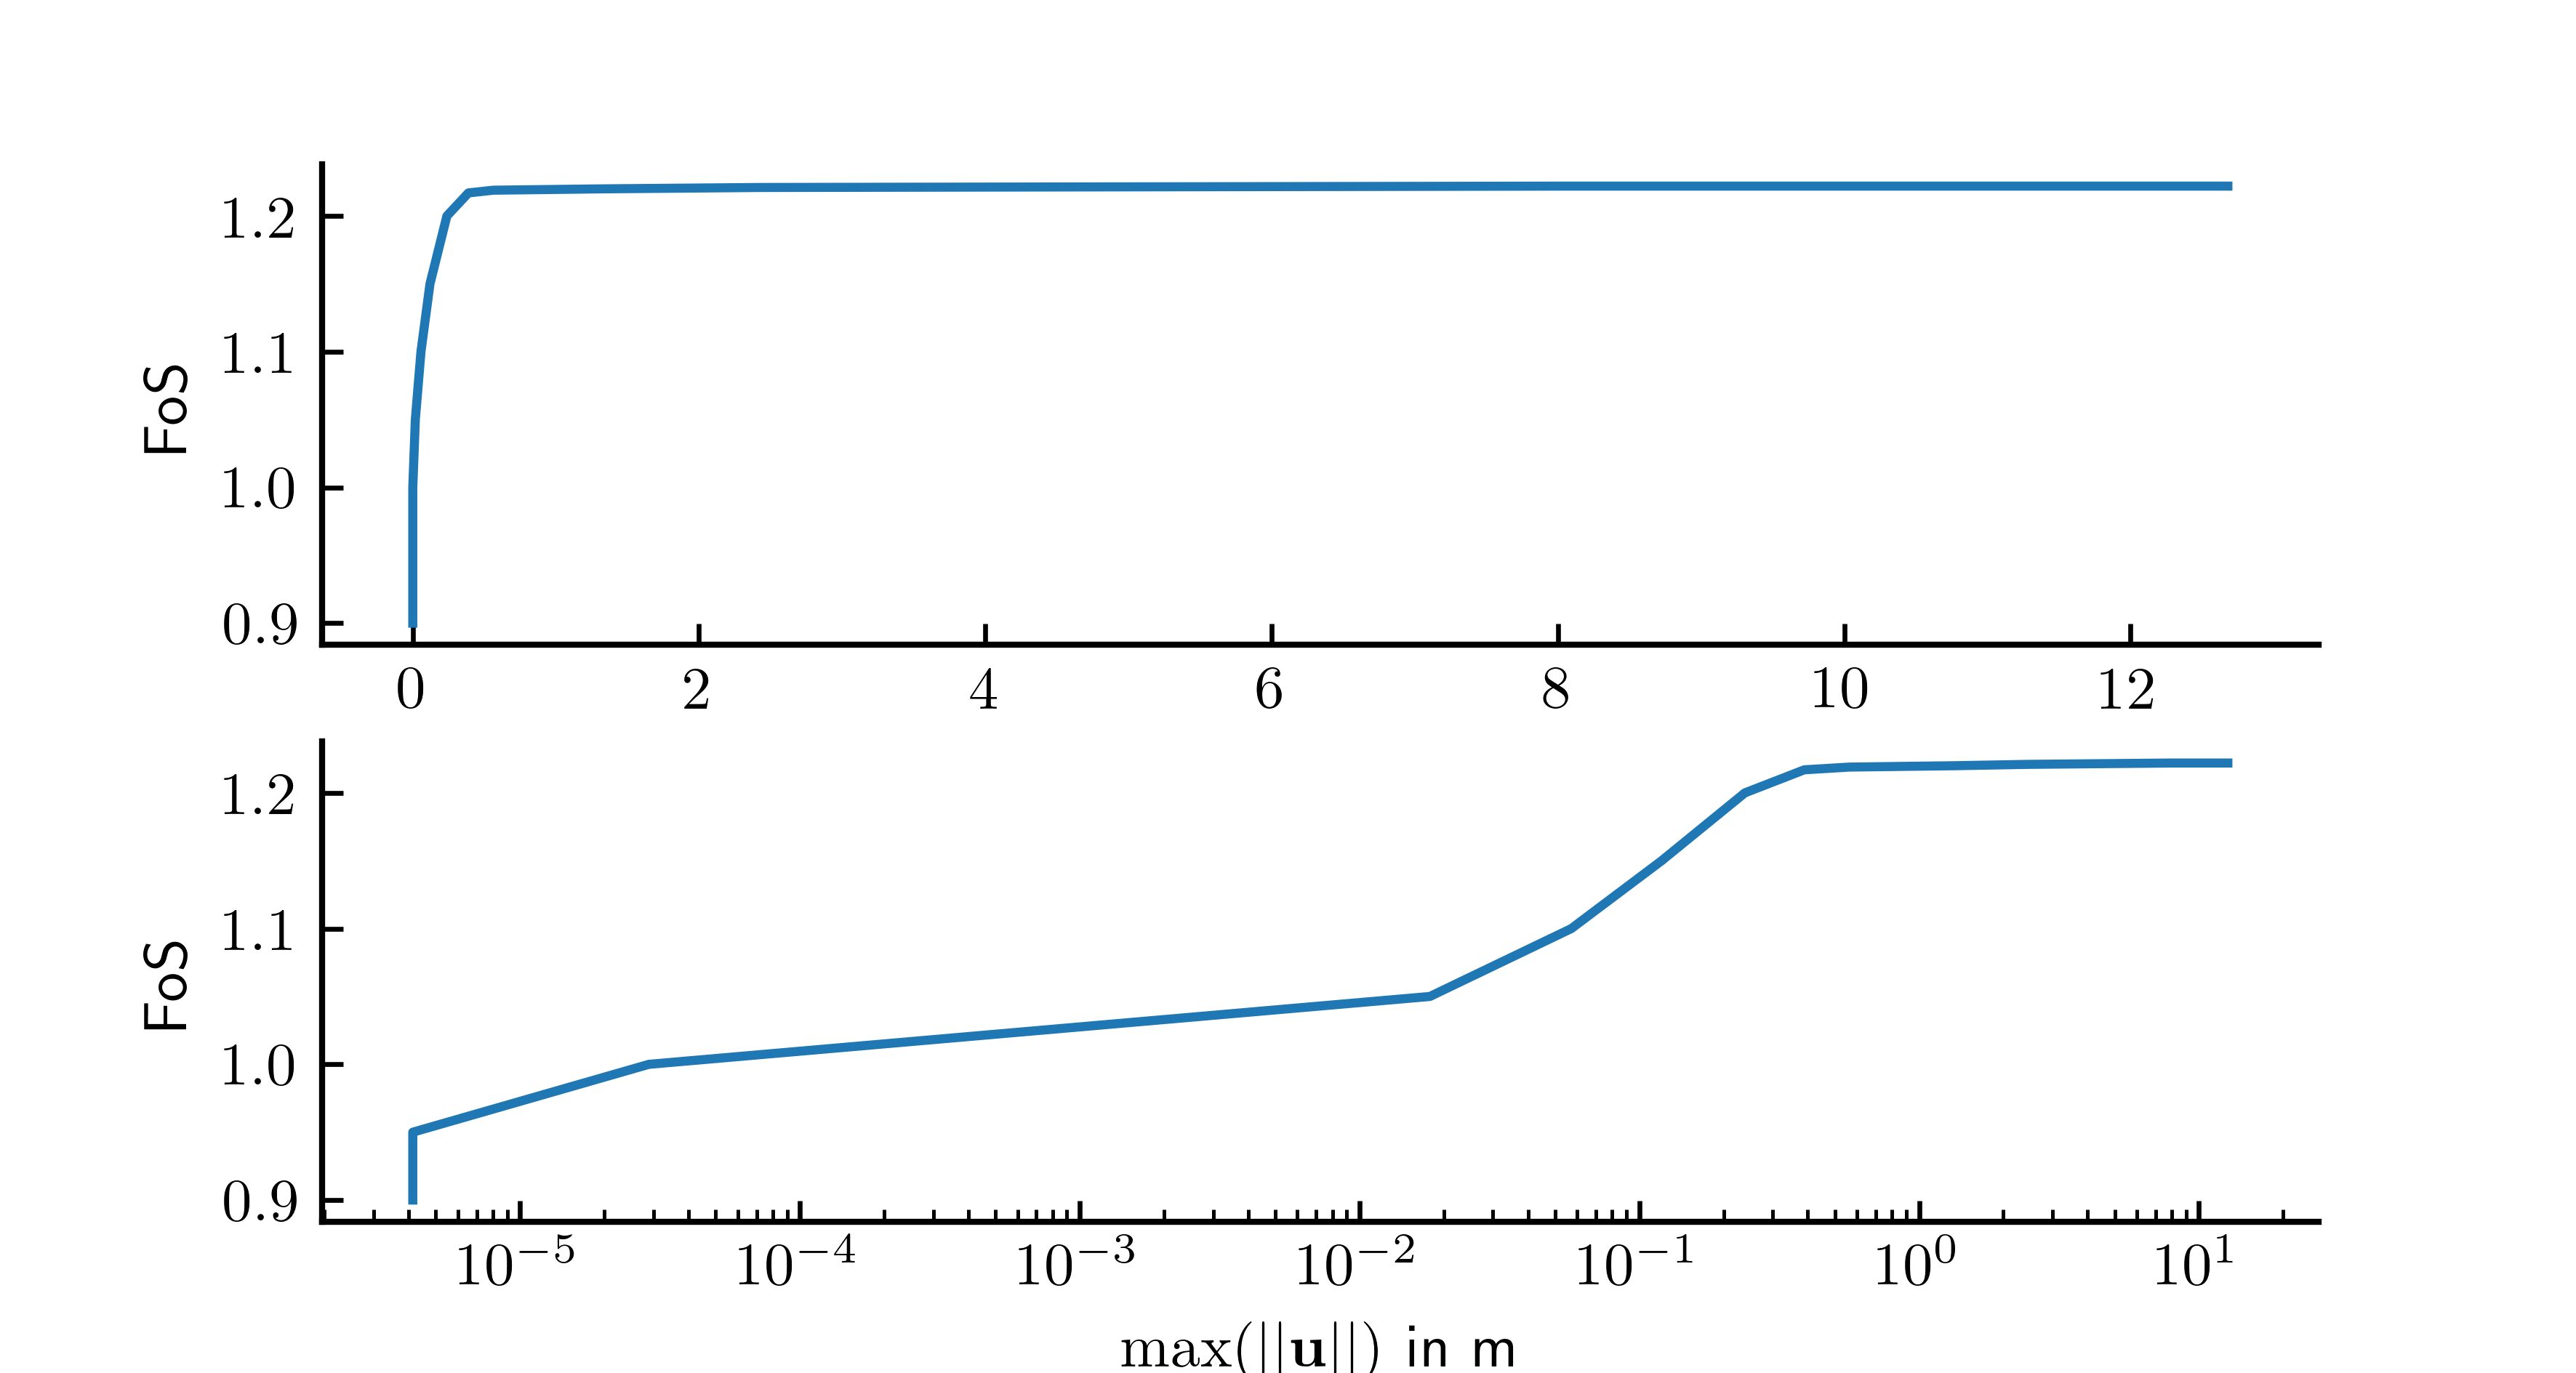
Figure 3. Max. displacement magnitude versus Factor of Safety (FoS) for case 1 Mohr-Coulomb-3, calculated with numgeo.
Summary of results for Mohr-Coulomb-2
| numgeo | Plaxis | ZSoil | GEO4 | RS2 | |
|---|---|---|---|---|---|
| case 1 | 1.22 | 1.22 | 1.21 | 1.31 | 1.22 |
| case 2 | 1.63 | 1.68 | 1.64 | 1.71 | 1.68 |
| case 3 | 0.99 | 0.99 | 0.95 | 1.17 | 1.05 |
| case 4 | 2.06 | 2.09 | 1.98 | 2.19 | 2.08 |
A second set of simulations has been performed with the Mohr-Coulomb-2 model using the FoS-Hyperbolic extrapolations strategy. Results are given in the table below. It can be seen, that the extrapolation scheme does not affect the final FoS values. However, inspection of the statistic files reveils noticeably speed-ups compared to the default settings (FoS-linear extrapolation).
| numgeo | Plaxis | ZSoil | GEO4 | RS2 | |
|---|---|---|---|---|---|
| case 1 | 1.22 | 1.22 | 1.21 | 1.31 | 1.22 |
| case2 | 1.63 | 1.68 | 1.64 | 1.71 | 1.68 |
| case3 | 0.99 | 0.99 | 0.95 | 1.17 | 1.05 |
| case4 | 2.06 | 2.09 | 1.98 | 2.19 | 2.08 |
Summary of results for Mohr-Coulomb-3
| numgeo | Plaxis | ZSoil | GEO4 | RS2 | |
|---|---|---|---|---|---|
| case 1 | 1.22 | 1.22 | 1.21 | 1.31 | 1.22 |
| case2 | 1.64 | 1.68 | 1.64 | 1.71 | 1.68 |
| case3 | N/A | 0.99 | 0.95 | 1.17 | 1.05 |
| case4 | 2.05 | 2.09 | 1.98 | 2.19 | 2.08 |
For case 3 with the Mohr-Coulomb-3 model, the build-up of the slope already produced excessive deformation such that the following strength-reduction is not reached. The simualtion fails at 99% of the gravity loading step.
-
J Pruška. Comparison of geotechnic softwares-geo fem, plaxis, z-soil. Vanícek, et al., Eds., XIII ECSMGE, 2009. ↩